Uniformly Accelerated Motion
Imagine you're sitting in a train that starts moving from a station. At first, it crawls — then it picks up speed smoothly, second by second. If you watch the speedometer, you might see it climb by the same amount every second: 0 to 10 km/h, then 10 to 20, then 20 to 30. That steady, predictable increase is the heart of uniformly accelerated motion.
The Intuition
When something moves with uniform acceleration, its velocity changes by the same amount in every equal interval of time. The change is constant — not faster one second and slower the next.
Think of a ball rolling down a gentle, straight ramp. It starts from rest. In the first second, it gains some speed. In the next second, it gains exactly the same amount of speed again. The acceleration — the rate of change of velocity — is fixed.
"Uniform" here means "constant" or "unchanging." It does not mean the speed is constant. In fact, the speed is changing — but the rate at which it changes is constant.
The Precise Statement
Uniformly accelerated motion is motion in a straight line where the acceleration a is constant in both magnitude and direction.
Mathematically, if v is velocity at time t, and u is the initial velocity (at t=0), then:
a=tv−u=constant
This single idea leads to the three famous equations of motion (for constant acceleration):
v=u+at
s=ut+21at2
v2=u2+2as
Here:
- u = initial velocity (at t=0)
- v = velocity at time t
- a = constant acceleration
- s = displacement in time t
What It Looks Like in Real Life
| Situation | Acceleration | Why it's (approximately) uniform |
|---|
| A car accelerating on a highway | ~2–3 m/s² | Engine provides roughly constant force |
| A ball dropped from a height | 9.8 m/s² downward | Gravity is nearly constant near Earth's surface |
| A train starting from a station | ~0.5 m/s² | Controlled by the driver to be smooth |
Not all motion is uniformly accelerated. A car stopping suddenly has deceleration that changes — it's not uniform. A roller coaster has acceleration that varies wildly. Uniform acceleration is an ideal model that works beautifully for many real situations (like free fall) but not all.
The Key Insight
The word "uniform" refers to the acceleration, not the velocity. If acceleration is constant, then:
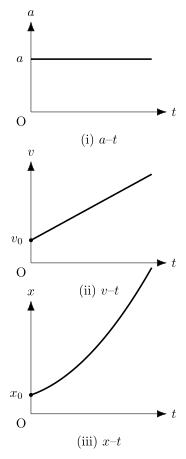
- Velocity changes linearly with time (a straight line on a v-t graph)
- Displacement changes quadratically with time (a parabola on an s-t graph)
This is why the equations above are so powerful: they let you predict position and velocity at any instant, as long as acceleration stays constant.
For uniformly accelerated motion, the v-t graph is always a straight line. The slope of that line equals the acceleration. If the graph is curved, acceleration is not uniform. …