Q.Draw Stress-strain curve to show the variation of Strain with Stress.
You're viewing a preview — the full solution, concept, methods & PYQ mapping are locked.
Start your 14-day free trial to unlock the full solution →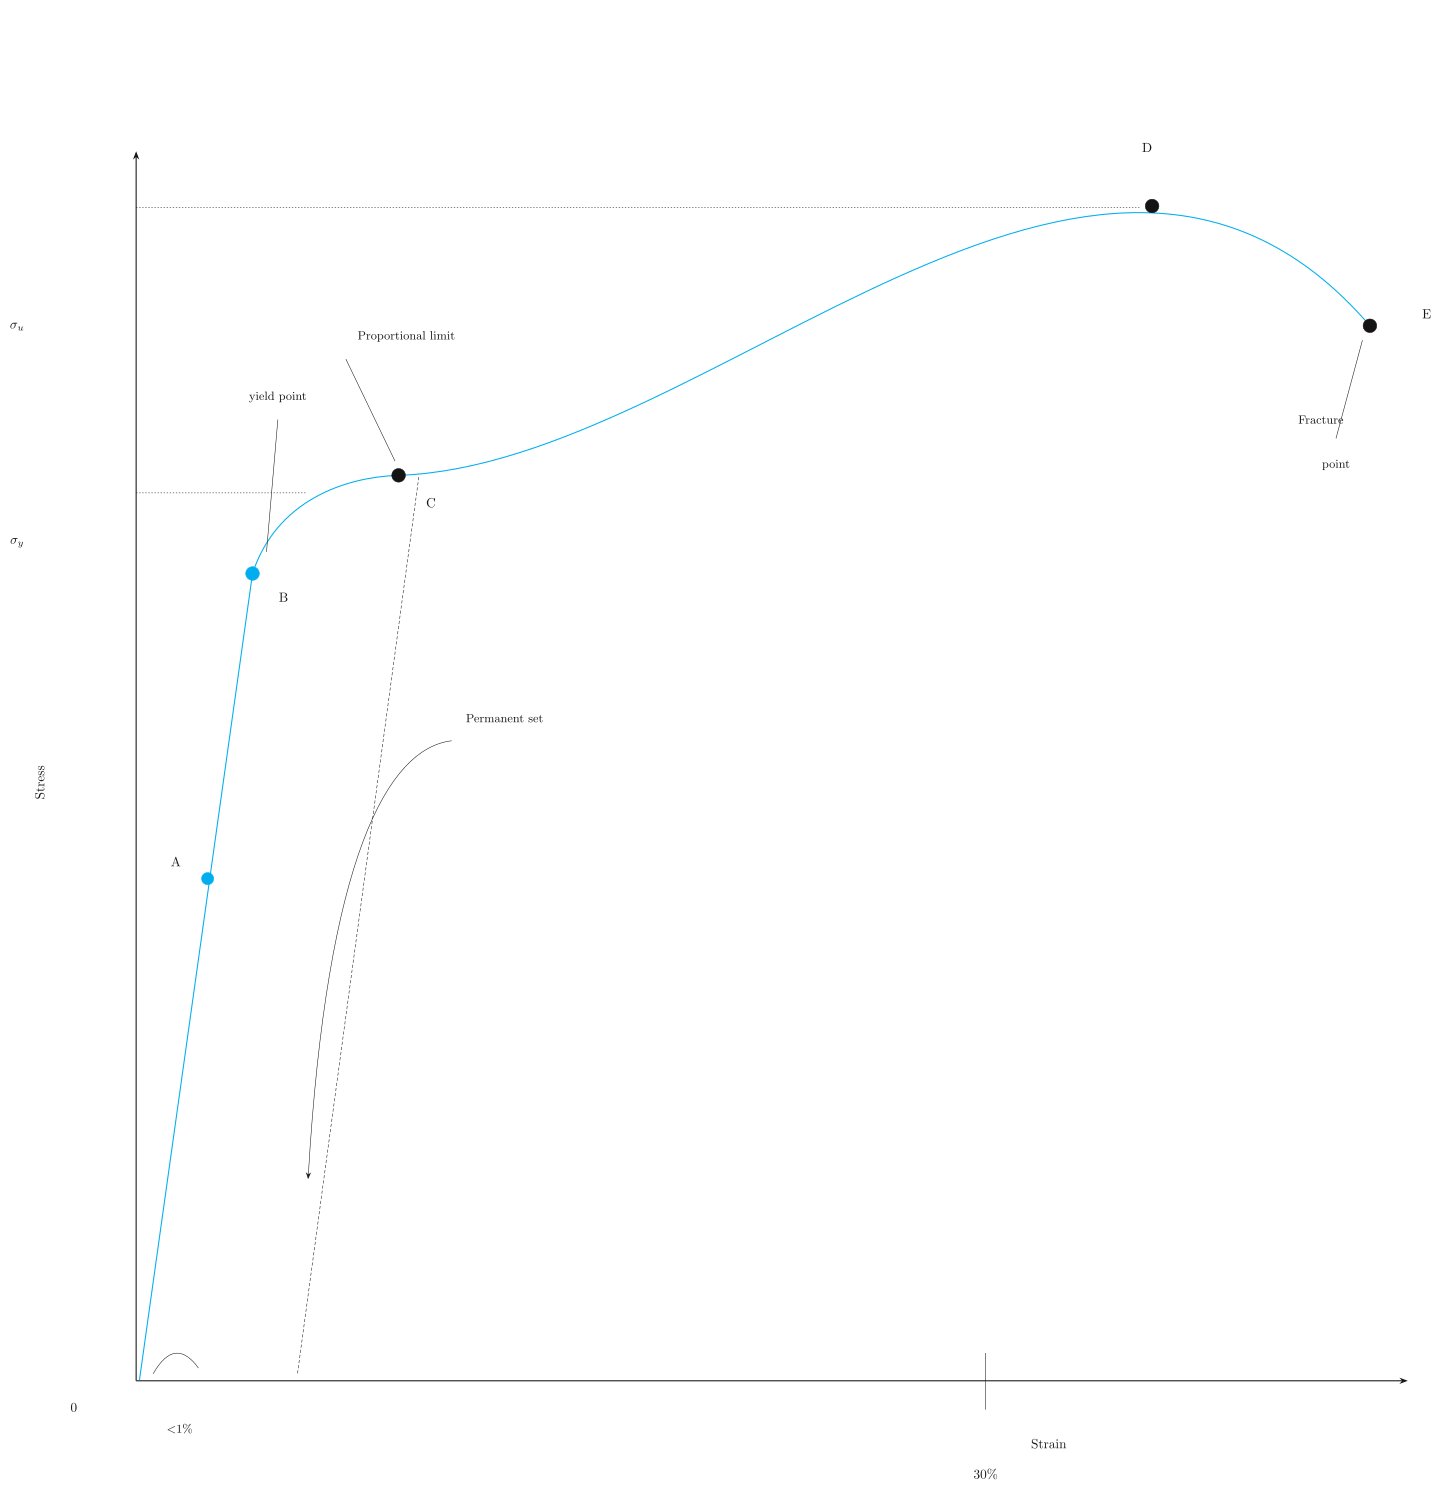
The stress-strain curve rises linearly (Hooke's law/elastic region) up to the proportional and elastic limits, then flattens into a plastic region of rapid strain for little added stress, peaks at the ultimate tensile strength, and drops to the fracture (breaking) point.
Description of the stress-strain curve (for a typical ductile metal wire under tension):
Plotting Stress (y-axis) against Strain (x-axis), starting from the origin O (no load), as stress is increased:
-
Proportional limit (O to P): The graph is a straight line through the origin. In this region, stress is directly proportional to strain -- this is Hooke's Law, and the slope of this straight-line portion gives the Young's modulus of the material.
-
Elastic limit: Slightly beyond the proportional limit, the curve starts to bend, but the material still returns to its original shape/size if the load is removed -- this point up to which the deformation is fully reversible (elastic) is called the elastic limit.
-
Yield point: Beyond the elastic limit, the material starts to undergo PLASTIC (permanent) deformation -- even a small further increase in stress produces a disproportionately large increase in strain. The material will no longer return to its original dimensions once the load is removed.
…
Unlock everything free for 14 days
- Full step-by-step solutions
- Concept-first explanations
- Methods, shortcuts & mistakes
- PYQ mapping + timed mock tests
Full access for 14 days. No credit card required.