Q.What does S-shaped pattern of population growth represent? How is J-shaped pattern different from it and why? Explain with the help of appropriate diagram.
You're viewing a preview — the full solution, concept, methods & PYQ mapping are locked.
Start your 14-day free trial to unlock the full solution →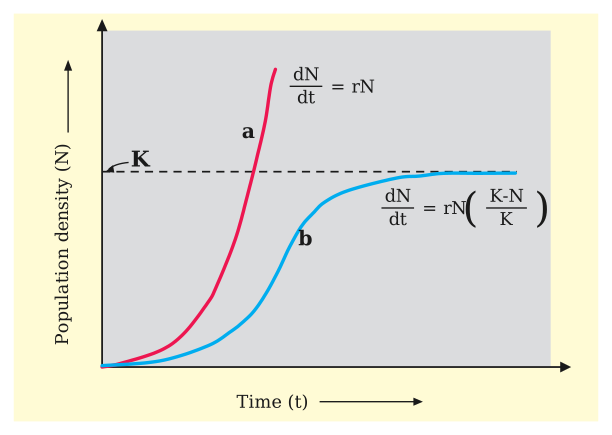
The S-shaped curve is logistic growth, slowing as resources become limiting near carrying capacity K; the J-shaped curve is exponential growth, which continues unchecked because it assumes unlimited resources.
S-shaped (sigmoid) growth pattern — logistic growth: In a real environment, resources (food, space, nutrients) are always finite. As a population grows, it depletes available resources, so its growth rate progressively slows and eventually levels off once the population reaches the carrying capacity (K) of that habitat — the maximum population size the environment can sustainably support. Plotting population size (N) against time under this model produces a characteristic S-shaped (sigmoid) curve, described by the logistic growth equation:
Initially (when N is small), growth is nearly exponential; as N approaches K, the term (K−N)/K shrinks toward zero, braking growth until it plateaus at K.
J-shaped growth pattern — exponential growth: This pattern is seen when resources in the environment are (unrealistically) assumed to be unlimited, so the population is free to grow at its intrinsic, maximum possible rate (r) with no restraint from resource availability. This is described by:
Plotting N against time produces a curve that rises ever more steeply — a J-shaped curve — because there is no carrying-capacity term to slow it down.
…
Unlock everything free for 14 days
- Full step-by-step solutions
- Concept-first explanations
- Methods, shortcuts & mistakes
- PYQ mapping + timed mock tests
Full access for 14 days. No credit card required.