Q.Draw a given population growth diagram in your answer sheet and labelling 1 to 4.
🔒You're viewing a preview — the full solution, concept, methods & PYQ mapping are locked.
🔒 Start your 14-day free trial to unlock the full solution →Concept understanding — Exponential Growth Rate
Exponential Growth Rate
A quantity grows exponentially when its rate of change is proportional to its current size: the more there is, the faster it grows. This differs sharply from linear growth, where a fixed amount is added each step. In exponential growth the quantity multiplies by the same factor over equal time intervals.
The differential equation
Let y(t) be the quantity and k>0 the proportionality constant. The rate law "rate of change proportional to the current amount" becomes
dtdy=ky.
This is a separable equation. Integrating,
∫ydy=∫kdt⟹log∣y∣=kt+C⟹y=y0ekt,
where y0=y(0) is the starting value. The constant k is the growth rate: a larger k means faster growth. (If k<0, the very same equation describes exponential decay.)
Reading the growth rate
Over each unit of time, y is multiplied by ek. So if the quantity doubles every unit of time, then ek=2, giving k=log2. This is how a stated doubling time is converted into the constant k.
Linear growth adds the same amount each step; exponential growth multiplies by the same factor. That is why an exponential quantity looks slow at first and then climbs steeply — the increase itself keeps getting bigger.
Where it appears …
Population density rises with natality (1) and immigration (2) and falls with mortality (3) and emigration (4).
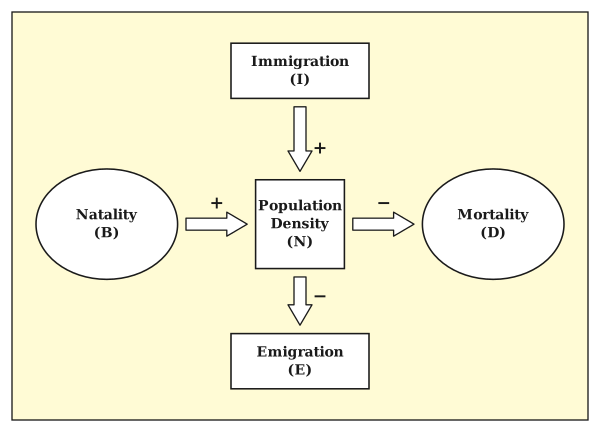
The diagram shows the four basic processes that change the density (N) of a population. The two '+' inputs increase the population, and the two '-' outputs decrease it:
- Position 1 (input, +): Natality - the number of births added to the population in a given time.
- Position 2 (input, +): Immigration - the number of individuals of the same species that come into the population (habitat) from elsewhere during a given period.
- Position 3 (output, -): Mortality - the number of deaths in the population in a given time. …
- CBSE 2025Set ANNUAL1 markQ.In a culture, the bacteria count is 1,00,000. The growth of bacteria is proportional to the number present. Let x be the number of bacteria at time t. Based on the above information, answer the following questions (assuming k to be the constant of proportionality): What is the relation between x and t?
›Reveal solutionSolution
Since the growth rate is proportional to the number present, x satisfies dtdx=kx, giving the exponential relation x=100000ekt.
The rate of growth of bacteria is proportional to the number of bacteria present at time t:
dtdx=kx
Separating variables and integrating,
∫xdx=∫kdt⟹lnx=kt+C
…
- CBSE 2025Set ANNUAL1 markQ.In a culture, the bacteria count is 1,00,000. The growth of bacteria is proportional to the number present. Let x be the number of bacteria at time t. Based on the above information, answer the following questions (assuming k to be the constant of proportionality): If the bacteria increased 10% in 2 hours, then find k.
›Reveal solutionSolution
Using x=100000ekt with a 10% increase at t=2 gives k=21ln(1.1)≈0.0477 per hour.
From the previous part, x=100000ekt.
The bacteria increase by 10% in 2 hours, so at t=2, x=100000+10% of 100000=110000.
110000=100000e2k
e2k=1.1
2k=ln(1.1) …
- CBSE 2025Set ANNUAL1 markQ.In a culture, the bacteria count is 1,00,000. The growth of bacteria is proportional to the number present. Let x be the number of bacteria at time t. Based on the above information, answer the following questions (assuming k to be the constant of proportionality): Find the time taken by the bacteria count increases from 1,00,000 to 2,00,000.
›Reveal solutionSolution
Doubling time follows from x=100000ekt: setting x=200000 gives t=kln2=ln1.12ln2≈14.55 hours.
We want the time t at which x=200000, starting from x=100000ekt:
200000=100000ekt
ekt=2
kt=ln2
t=kln2
Using k=21ln(1.1) from the previous part,
t=21ln(1.1)ln2=ln(1.1)2ln2
…
- CBSE 2024Set 57/3/11 markMCQQ.The population growth curve applicable for a population growing in a geometric fashion, when the resources are not limiting in the habitat will be : (A) [graph: Population density vs Time — horizontal line] (B) [graph: Population density vs Time — straight rising line] (C) [graph: Population density vs Time — exponential (J-shaped) curve] (D) [graph: Population density vs Time — sigmoid (S-shaped) curve]
›Reveal solutionSolution
Geometric (exponential) growth with unlimited resources produces a J-shaped curve where population density accelerates upward without bound; the answer is (C).
When a population grows geometrically—meaning each individual produces a constant number of offspring per unit time—and resources are unlimited, we're describing exponential growth. The key insight is that the population doesn't just add a fixed number of individuals each generation; instead, it multiplies by a constant factor. A population of 100 that doubles becomes 200, then 400, then 800—the increment itself grows larger with each step because more parents produce more offspring.
Mathematically, this is captured by:
dN/dt = rN
where N is population size, t is time, and r is the intrinsic rate of increase. The solution is N(t) = N₀ e^{rt}, an exponential function. The hallmark of exponential growth is that the rate of increase is proportional to the current population size—bigger populations grow faster.
Now let's match this behavior to the graph options:
-
Option (A): Horizontal line
A flat line means zero growth—the population size stays constant. This describes a population at equilibrium or with birth rate exactly matching death rate, not geometric growth.
-
Option (B): Straight rising line
A linear increase means the population adds the same absolute number of individuals per unit time (arithmetic growth). If you gain 10 individuals per year regardless of population size, that's dN/dt = k (constant), not dN/dt = rN. This doesn't capture the accelerating nature of geometric growth.
-
Option (C): J-shaped (exponential) curve
This curve starts slowly, then rises steeply, accelerating upward without leveling off. The slope gets steeper as time progresses because the population itself is growing—more individuals mean more reproduction. This is the signature of exponential growth when resources are unlimited and nothing checks the population. …
-
- CBSE 2023Set ANNUAL1 markQ.Write the function f(x), where f′(x)=f(x).
›Reveal solutionSolution
The differential equation f′(x)=f(x) is solved by separation of variables, giving the exponential function.
We have dxdf=f. Separating variables (assuming f=0):
fdf=dx
Integrating both sides:
ln∣f∣=x+c1
f(x)=Cex, where C=±ec1 is an arbitrary constant.
…
- CBSE 2022Set HE2201 markQ.Write the answer in one word/sentence: Types of curves are obtained in the growth of organism.
›Reveal solutionSolution
Populations can grow exponentially (J-curve, unlimited resources) or logistically (S-curve, limited resources/carrying capacity).
When resources (food, space) in a habitat are unlimited, a population grows exponentially, and a plot of population size against time gives a J-shaped curve (dN/dt = rN). In nature, resources are finite, so growth eventually slows as the population approaches the habitat's carrying capacity (K); a plot of this pattern gives an S-shaped (sigmoid) curve, described by the logistic growth equation …
- CBSE 2017Set ANNUAL1 markQ.In a given habitat, the maximum number possible for a species is called ________ of that species in that habitat.
›Reveal solutionSolution
The maximum population size that a given habitat can sustainably support is called the carrying capacity of that habitat for the species.
Every habitat has a finite amount of resources (food, space, nesting sites, etc.), so a population of a species cannot keep growing indefinitely within it. The largest population size that the habitat's resources can support — beyond which the population cannot be sustained (due to resource limitation, competition, increased mortality, etc.) — is termed the carrying capacity (K) of that habita …
🎓Unlock everything free for 14 days
- ✓Full step-by-step solutions
- ✓Concept-first explanations
- ✓Methods, shortcuts & mistakes
- ✓PYQ mapping + timed mock tests
Full access for 14 days. No credit card required.