Biology · Ch 4 — Principles of Inheritance and Variation
Chromosomal Theory of Inheritance
Chromosomal Theory of Inheritance
Mendel published his work in 1865, but it was largely ignored until 1900. There were several reasons for this delay. First, scientific communication was slow in the 19th century, so his findings could not spread widely. Second, his idea that traits are controlled by stable, discrete units (which he called factors) — and that these factors do not blend — went against the common belief that inheritance was a blending process, which seemed to explain the continuous variation seen in nature. Third, Mendel’s use of mathematics to explain biology was completely new and unacceptable to most biologists of his time. Finally, although Mendel’s work suggested that factors (genes) exist, he could not provide any physical proof for them or say what they were made of.
In 1900, three scientists — de Vries, Correns, and von Tschermak — independently rediscovered Mendel’s results. By then, advances in microscopy allowed scientists to observe cell division in detail. They discovered structures in the nucleus that appeared to double and divide just before each cell division. These were called chromosomes (meaning “colored bodies,” because they were visualised by staining). By 1902, the movement of chromosomes during meiosis had been worked out.
Walter Sutton and Theodore Boveri independently noticed that the behaviour of chromosomes during cell division paralleled the behaviour of Mendel’s genes. They used chromosome movement to explain Mendel’s laws. The key parallels they observed are:
- Both chromosomes and genes occur in pairs.
- The two alleles of a gene pair are located on homologous sites on homologous chromosomes.
- During gamete formation, the two members of a pair segregate (separate) so that only one of each pair is transmitted to a gamete.
- Different pairs of chromosomes (and therefore different gene pairs) segregate independently of each other during meiosis.
This is summarised in a comparison table (Table 4.3 in the textbook):
| Behaviour of Chromosomes | Behaviour of Genes |
|---|---|
| Occur in pairs | Occur in pairs |
| Segregate at the time of gamete formation such that only one of each pair is transmitted to a gamete | Segregate at gamete formation and only one of each pair is transmitted to a gamete |
| Independent pairs segregate independently of each other | One pair segregates independently of another pair |
Sutton and Boveri argued that the pairing and separation of a pair of chromosomes would lead to the segregation of the pair of factors (genes) they carried. Sutton united the knowledge of chromosomal segregation with Mendelian principles and called it the chromosomal theory of inheritance. …
Drawn by us to help you understand the concept clearly, and verified to make sure it's accurate. For exams, practice from your textbook's own diagram.
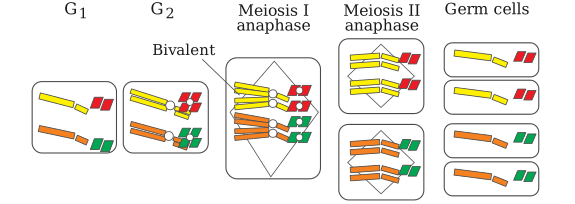
Figure 4.8 shows a single cell with four chromosomes — two homologous pairs — going through the two divisions of meiosis to produce four haploid gametes. The cell is drawn at the start of meiosis I, with each chromosome already replicated into two sister chromatids. One homologous pair is shown in one colour (say, long orange and long yellow), and the other pair in a second colour (short green and short red). The key point is that the two members of each pair are physically different in colour, representing the two different alleles of a gene.
The figure is laid out as a flow from left to right. At the far left is the parent cell, with all four chromosomes visible as separate structures. An arrow leads to the next stage: prophase I, where the homologous chromosomes have paired up (synapsis) — the long orange pairs with the long yellow, and the short green pairs with the short red. A second arrow leads to metaphase I, where these paired homologues are aligned at the equator of the cell. Then an arrow leads to anaphase I, where the homologous pairs separate — one chromosome from each pair moves to opposite poles. Notice that the two pairs are shown segregating independently: in one possible arrangement, the long orange and short green go to the same pole, while long yellow and short red go to the other. This is the key visual — it shows that the orientation of each homologous pair on the metaphase plate is random.
After anaphase I, the cell divides (cytokinesis), producing two cells, each with two chromosomes (one from each homologous pair). Each chromosome still consists of two sister chromatids. An arrow leads to meiosis II, where the sister chromatids separate in anaphase II. The final result is four gametes, each with a single copy of each chromosome — one long (either orange or yellow) and one short (either green or red). The four gametes are drawn at the far right, showing all four possible combinations: orange+green, orange+red, yellow+green, yellow+red. …
Drawn by us to help you understand the concept clearly, and verified to make sure it's accurate. For exams, practice from your textbook's own diagram.
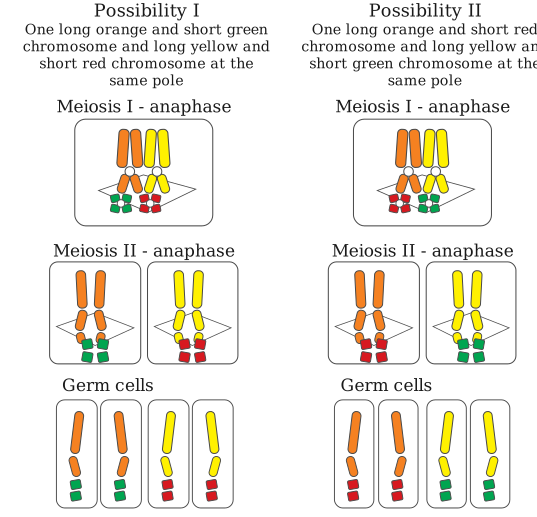
Figure 4.9 is a schematic of a cell at metaphase I of meiosis, containing two pairs of homologous chromosomes. Each chromosome is drawn as a thick rod, and the two members of a homologous pair are distinguished by length and colour. One pair consists of a long orange chromosome and a long yellow chromosome; the other pair consists of a short green chromosome and a short red chromosome. The figure is split into two side-by-side panels, labelled Possibility I (left) and Possibility II (right). Each panel shows the same four chromosomes arranged at the metaphase plate (the equator of the cell), but the orientation of each homologous pair differs between the two possibilities.
In Possibility I, the long orange and long yellow chromosomes are aligned such that the orange chromosome is on the left side of the plate and the yellow chromosome on the right. The short green and short red chromosomes are aligned so that the green chromosome is on the left and the red on the right. Consequently, when anaphase I pulls one chromosome from each pair to opposite poles, the left pole receives the long orange and short green chromosomes together, while the right pole receives the long yellow and short red chromosomes together.
In Possibility II, the long orange and long yellow chromosomes are still aligned with orange on the left and yellow on the right, but the short pair is now oriented the opposite way: the short red chromosome is on the left and the short green on the right. As a result, the left pole receives the long orange and short red chromosomes together, and the right pole receives the long yellow and short green chromosomes together. …
Drawn by us to help you understand the concept clearly, and verified to make sure it's accurate. For exams, practice from your textbook's own diagram.
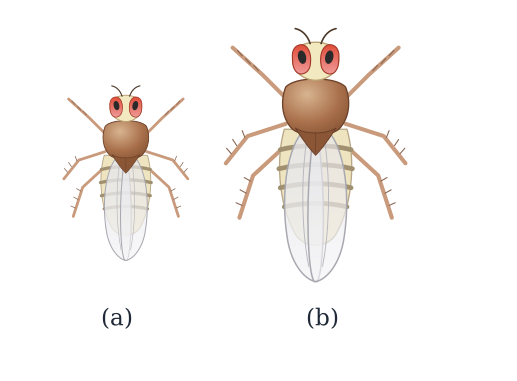
Figure 4.10 is a simple side-by-side comparison of a male and a female Drosophila melanogaster fruit fly. The figure has two panels, labelled (a) and (b). Panel (a) shows the male fly; panel (b) shows the female fly. No arrows, labels, or other markings are present on the flies themselves — the entire point is the visual contrast between the two sexes.
The male (a) is noticeably smaller than the female (b). The female (b) is larger and has a more rounded, elongated abdomen. The male’s abdomen is shorter and more blunt, with a distinct dark patch at the tip — a feature that is absent in the female. These external differences are what Morgan relied on to easily distinguish males from females in his breeding experiments.
What this figure teaches is that Drosophila is an ideal organism for genetic studies precisely because sex can be determined at a glance, without dissection or microscopy. This allowed Morgan to set up controlled crosses quickly and to track traits across generations. The size difference also hints at the fact that the male is the heterogametic sex (XY) in fruit flies, though the figure itself does not show chromosomes — it only shows the outward appearance that results from those chromosomal differences. …