Question of 51
Q.An astronaut in a space shuttle moves along a straight line. The data given below give the measured velocities starting from t = 2s.
Time(s): 2, 4, 6, 8, 10, 12, 13, 16
Velocity(m/s): 2, 4, 6, 2, 0, –2, –4, –2
Draw the velocity-time graph from 2s to 16s (use of graph paper is not required)
Kerala DhseKerala DHSE Plus One Board 2021Subjective· 3mImportance★★★★★
0% · 0/51 Questions
You're viewing a preview — the full solution, concept, methods & PYQ mapping are locked.
Start your 14-day free trial to unlock the full solution →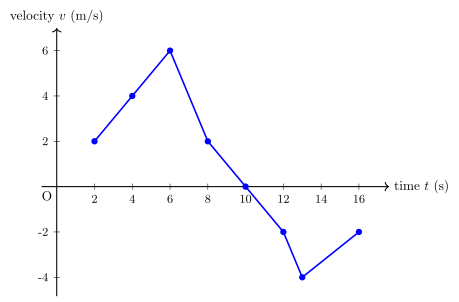
Since only discrete (t, v) data points are given (not a continuous formula), the velocity-time graph is drawn by plotting these 8 points on a v–t axis and joining successive points with straight-line segments — this is what "draw the v–t graph from the given data" means when only tabulated readings are available.
The data:
| t (s) | 2 | 4 | 6 | 8 | 10 | 12 | 13 | 16 |
|---|---|---|---|---|---|---|---|---|
| v (m/s) | 2 | 4 | 6 | 2 | 0 | −2 | −4 | −2 |
How to draw it (since this is a text medium, use graph/plain paper and plot exactly this):
- Take time t (s) along the horizontal axis and velocity v (m/s) along the vertical axis (mark both positive and negative v, since the astronaut's velocity becomes negative after some time).
- Plot the 8 points: (2, 2), (4, 4), (6, 6), (8, 2), (10, 0), (12, −2), (13, −4), (16, −2).
- Join each point to the next with a straight line segment (the data doesn't tell us the motion in between, so the standard convention is to connect consecutive readings linearly).
Shape of the resulting graph:
- From t = 2s to t = 6s: velocity rises steadily from 2 m/s to a peak of 6 m/s (the shuttle is speeding up / accelerating positively). …
Unlock everything free for 14 days
- Full step-by-step solutions
- Concept-first explanations
- Methods, shortcuts & mistakes
- PYQ mapping + timed mock tests
Full access for 14 days. No credit card required.