Question of 51
Q.(a) Draw velocity-time graph for uniformly accelerated motion.
(1)
(b) Write the significance of v-t graph.
(2)
(c) Derive the equation s = ut + ½ at² from the v-t graph. (2)
Kerala DhseKerala DHSE Plus One Board 2024Subjective· 5mImportance★★★★★
0% · 0/51 Questions
You're viewing a preview — the full solution, concept, methods & PYQ mapping are locked.
Start your 14-day free trial to unlock the full solution →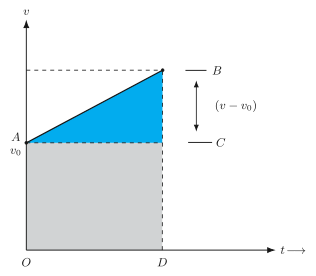
For uniformly accelerated motion, the v-t graph is a straight, sloped line (not a curve, since a is constant). Its slope = acceleration, and the area enclosed between the graph and the time axis = displacement. Splitting that area into a rectangle and a triangle gives s = ut + ½at².
- The v-t graph for uniformly accelerated motion Since the velocity changes by an equal amount every equal interval of time when acceleration is constant, the graph of velocity (v, on the y-axis) versus time (t, on the x-axis) is a straight line. It starts at the initial velocity u when t = 0, and rises (for positive acceleration) or falls (for negative acceleration/retardation) linearly, reaching a value v at time t. If u = 0, the line passes through the origin.
- Significance of the v-t graph
- Slope of the v-t graph = acceleration. Since slope = (v - u)/t = a, a steeper line means larger acceleration; a horizontal line means zero acceleration (uniform velocity); a line sloping downward means the body is decelerating (retardation).
- Area under the v-t graph (between the line and the time axis) = displacement (or distance) covered in that time interval, because velocity × time gives displacement, and the area under a v-t curve is exactly the sum of all such v·dt strips.
(c) Deriving s = ut + ½at² from the v-t graph
Consider the v-t graph: a straight line starting at height u (initial velocity) at t = 0, and rising linearly to height v at time t.
…
Unlock everything free for 14 days
- Full step-by-step solutions
- Concept-first explanations
- Methods, shortcuts & mistakes
- PYQ mapping + timed mock tests
Full access for 14 days. No credit card required.