Worked Examples · Example 7
Q.Using the ogive of the distribution in Worked Example 5 (classes , frequencies , ), explain how to locate , and graphically and state the values read.
Maharashtra MsbshseTextbookSubjectiveImportance★★★★★est
92% · 12/13 Questions
You're viewing a preview — the full solution, concept, methods & PYQ mapping are locked.
Start your 14-day free trial to unlock the full solution →Step 1 — plot the ogive. Plot each class's upper boundary against its less-than cumulative frequency, starting at the lower boundary of the first class with height :
and join them with a smooth rising curve.
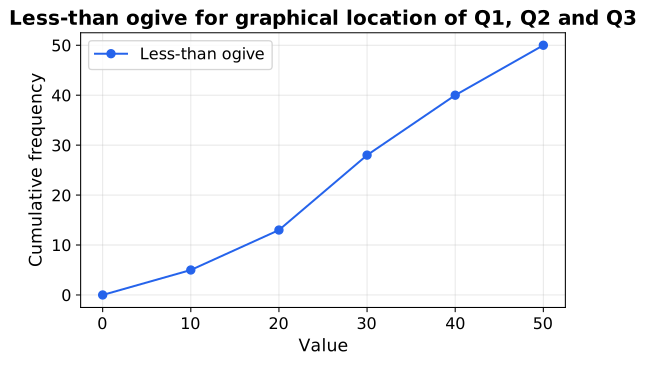
Step 2 — mark the locating figures on the -axis. For quartiles these are , and .
Step 3 — read across and down. From each marked height draw a horizontal line to the ogive, then a vertical line down to the -axis:
- meets the curve at about → . …
Unlock everything free for 14 days
- Full step-by-step solutions
- Concept-first explanations
- Methods, shortcuts & mistakes
- PYQ mapping + timed mock tests
Full access for 14 days. No credit card required.