Chemistry · Ch 6 — Chemical Kinetics
Effect of a catalyst on the rate of reaction
Effect of a catalyst on the rate of reaction
A catalyst is a substance added to the reactants that increases the rate of the reaction without itself being consumed in the reaction. Consider
Here is the catalyst. It has been observed that the decomposition rate increases with the addition of the catalyst.
The book prints this equation as "2 KClO₃(s)+ 3O₂(g) 2 KCl(s)" — with the oxygen on the reactant side and missing from the products. The decomposition of potassium chlorate in fact produces the oxygen, as the corrected equation above shows.
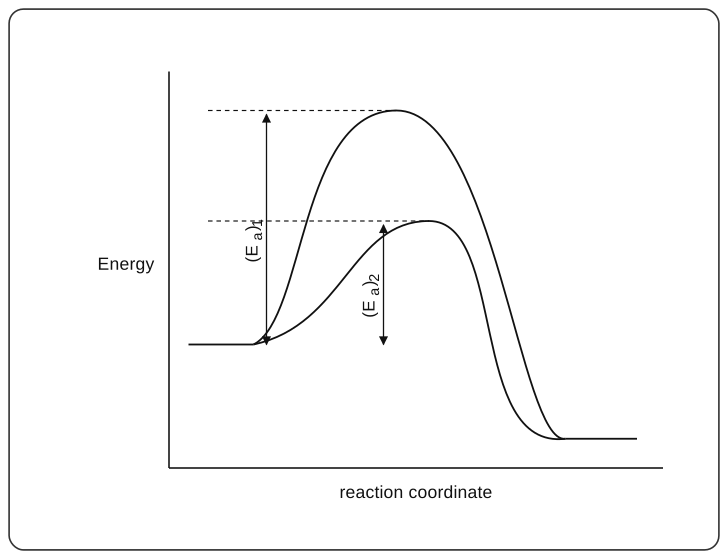
A catalyst provides an alternative pathway associated with lower activation energy.
Fig. 6.10 compares the potential energy barriers for the catalysed and uncatalysed reactions. The barrier for the uncatalysed reaction, , is larger than that for the same reaction in the presence of a catalyst, .
Drawn by us to help you understand the concept clearly, and verified to make sure it's accurate. For exams, practice from your textbook's own diagram.
What this figure shows. Two energy pathways connect the same reactant level to the same product level along the reaction coordinate. The taller curve is the uncatalysed reaction, with barrier height ; the shorter curve is the catalysed pathway the catalyst provides, with the smaller barrier . Because , far more collisions can clear the catalysed barrier — the catalyst speeds the …
Consider the decomposition of in aqueous solution, catalysed by ions:
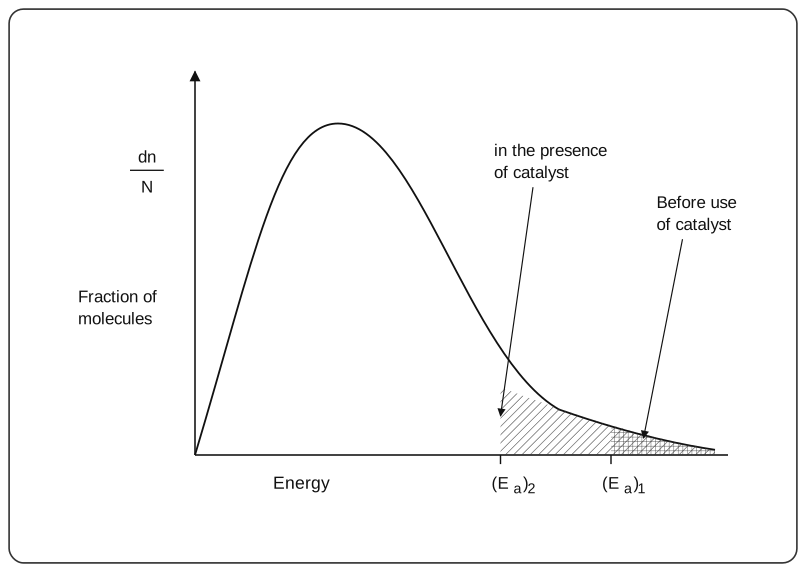
At room temperature the rate of the reaction is slower in the absence of the catalyst, with its activation energy being 76 kJ mol⁻¹. In the presence of the iodide ion catalyst the reaction is faster, since the activation energy decreases to 57 kJ mol⁻¹. …
Drawn by us to help you understand the concept clearly, and verified to make sure it's accurate. For exams, practice from your textbook's own diagram.
What this figure shows. A single distribution curve (, the fraction of molecules) against Energy, with the two threshold energies on the axis: — the activation energy in the presence of the catalyst — sits to the LEFT of , the activation energy before use of the catalyst. The shaded area beyond each threshold is the fraction of molecules energetic enough to react: lowering the threshold from to sweeps a much larger f …