Q.A ball is thrown vertically upwards. Draw its velocity-time graph.
🔒You're viewing a preview — the full solution, concept, methods & PYQ mapping are locked.
🔒 Start your 14-day free trial to unlock the full solution →Concept understanding — Motion Under Gravity
Motion Under Gravity – The Intuition First
Drop a ball. It falls. Why? Because the Earth pulls it. But the key insight is not just that it falls — it's how it falls. If you drop a stone from a cliff, does it move at a constant speed? No. It gets faster as it goes down. That's the heart of motion under gravity: the pull is steady, so the acceleration is steady.
Now imagine throwing a ball straight up. It rises, slows down, stops for an instant at the top, then falls back down. The same pull that made it slow down on the way up makes it speed up on the way down. The acceleration never changes direction — it always points downward, toward the centre of the Earth.
That constant downward acceleration is called g. Near the Earth's surface, its magnitude is about 9.8 m/s2 (often taken as 10 m/s2 in exams for quick calculation). The direction is always downward.
In one-dimensional motion under gravity, the acceleration is constant and equal to g downward. This is true only when air resistance is negligible and the height is small compared to the Earth's radius.
The Precise Statement
Motion under gravity (in one dimension) means an object moves vertically under the sole influence of the Earth's gravitational pull. The acceleration is:
a=−g
where the negative sign indicates downward direction (if we take upward as positive). The value of g is 9.8 m/s2 (or 10 m/s2 in many problems).
Because acceleration is constant, all three equations of uniformly accelerated motion apply directly:
v=u+at
s=ut+21at2
v2=u2+2as
But here a is replaced by −g (if upward is positive) or +g (if downward is positive). The choice of sign convention is yours — just be consistent.
v=u−gt
s=ut−21gt2
v2=u2−2gs
(Taking upward as positive, g=9.8 m/s2)
Key Features You Must Know
1. Free Fall (dropped from rest)
If you simply let go of an object (u=0), it falls with increasing speed. After time t, its velocity is v=gt (downward). The distance fallen is s=21gt2.
2. Projected Upward
If you throw a ball upward with speed u, it rises until its velocity becomes zero at the highest point. That takes time t=u/g. The maximum height reached is h=u2/(2g).
3. Symmetry of the Motion
The time to go up equals the time to come back down (to the same height). The speed at which it returns to the launch point equals the initial speed u (but downward). This symmetry is a direct consequence of constant acceleration.
At the highest point, velocity is zero but acceleration is still g downward. Many beginners think acceleration becomes zero at the top — it does not. The object is momentarily at rest, but gravity is still pulling it.
A Simple Example …
Taking upward as positive, the ball's velocity decreases uniformly from its initial value to zero at the top, then becomes increasingly negative as it falls — a single straight line throughout. …
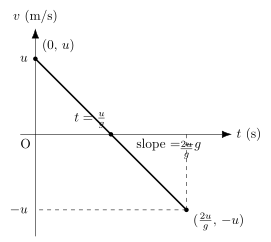
For a ball thrown vertically upward, the v-t graph is a single straight line of constant negative slope −g: it starts at +u, crosses zero at the top of the flight, and goes negative as the ball falls.
Take the upward direction as positive. The only acceleration acting on the ball once released (ignoring air resistance) is due to gravity, of magnitude g, directed downward, so a=−g, a constant, throughout the motion — both while rising and while falling.
Using v=u−gt:
- At t=0: v=u (maximum, positive — the ball is moving upward as fast as it ever will).
- As t increases, v decreases uniformly (a straight line of slope −g).
- At t=u/g: v=0 — the ball is momentarily at rest at the highest point of its path.
- For t>u/g: v becomes negative — the ball is now moving downward, continuing along the exact same straight line (same constant slope −g).
- If it is caught again at the height from which it was thrown, at t=2u/g: v=−u (same speed as launch, but now directed downward). …
Showing the 12 most recent of 13 on this concept.
- CBSE 2026Set ANNUAL1 markMCQQ.If an object is thrown vertically upward, then at the highest point its velocity will be(a) maximum(b) same as initial velocity(c) zero(d) none of these
›Reveal solutionSolution
At the highest point of upward motion the velocity is momentarily zero. Answer (C).
When an object is thrown vertically upward, gravity decelerates it at g. Its speed keeps decreasing until, at the highest point, it becomes zero (v = u - gt reaches 0 when t = u/g).
…
- CBSE 2025Set ANNUAL1 markMCQQ.Which one is uniform of a body falling freely under the action of gravity? (A) Momentum (B) Acceleration (C) Velocity (D) Speed
›Reveal solutionSolution
Acceleration is the uniform (constant) quantity during free fall; velocity, speed, and momentum all keep changing.
For a body falling freely under gravity (ignoring air resistance):
- Acceleration a=g, a fixed constant value at a given place — does not change with time.
- Velocity v=u+gt — increases continuously with time. …
- CBSE 2025Set ANNUAL1 markMCQQ.A stone dropped from the bridge reaches the water in 4 seconds. The height of the bridge is(a) 78.4 m(b) 2 m(c) 260 m(d) 32 m
›Reveal solutionSolution
Free fall from rest: h = (1/2) g t^2 = (1/2)(9.8)(4)^2 = 78.4 m.
The stone is dropped (initial velocity u = 0) and falls freely under gravity for t = 4 s.
Using the second equation of motion: h = u*t + (1/2) g t^2
…
- CBSE 2025Set ANNUAL1 markMCQQ.A body dropped from the top of the tower of height H meters. It takes 'T' time to reach the ground. Where is the body T/2 time after the release?(a) At H/2 meters from the ground(b) At H/4 meters from the ground(c) At 3H/4 meters from the ground(d) Depends on mass and volume of body
›Reveal solutionSolution
At half the total fall time, the body has covered only a quarter of the total height (not half), because distance under free fall grows with t2, not t.
Let the body fall from height H and reach the ground in time T. Using H=(1/2)gT2 ... (1)
Distance fallen in time T/2: h=(1/2)g(T/2)2=(1/2)g⋅T2/4=(1/4)[(1/2)gT2]=H/4
So after T/2 seconds, the body has fallen H/4 metres. Its height above the ground at that instant is:
H−H/4=3H/4
…
- CBSE 2025Set ANNUAL1 markMCQQ.An object is dropped in a planet from height 50 m, it reaches the ground in 2 s. The acceleration due to gravity in the planet is:(a) g = 15 ms^-2(b) g = 20 ms^-2(c) g = 30 ms^-2(d) g = 25 ms^-2
›Reveal solutionSolution
Using h = (1/2) g t^2 for an object dropped from rest, h = 50 m and t = 2 s give g = 25 ms^-2.
When an object is 'dropped' (released from rest, initial velocity u = 0) and falls under a constant gravitational acceleration g, the distance fallen in time t is given by the standard kinematic equation:
h = u t + (1/2) g t^2 = (1/2) g t^2 (since u = 0)
Substitute the given values h = 50 m, t = 2 s:
50 = (1/2) x g x (2)^2 …
- CBSE 2024Set ANNUAL1 markMCQQ.A body falling freely under gravity has uniform (A) Speed (B) Velocity (C) Momentum (D) Acceleration
›Reveal solutionSolution
Free fall under gravity has uniform acceleration g, not uniform speed/velocity/momentum.
During free fall, the only force is gravity (weight mg, ignoring air resistance), which is constant. By Newton's second law, acceleration =F/m=g, a constant value throughout the fall. Speed, veloci …
- CBSE 2024Set ANNUAL1 markMCQQ.A ball is projected vertically upwards with a velocity v. It comes back to ground in time t. Which of the following v-t graph shows the motion correctly?(a) graph(a)(b) graph(b)(c) graph(c)(d) graph(d) (The four option graphs are shown in the original question paper.)
›Reveal solutionSolution
Under constant gravitational deceleration, velocity changes linearly with time throughout the whole up-and-down motion, so the v-t graph must be a single straight line, not a V-shape or triangle shape.
When a ball is projected vertically upward with initial velocity v and returns to the same point (the ground) in time t, its acceleration is constant throughout the motion: a = -g (taking upward as positive), because gravity acts continuously, both while going up and coming down — there is no sudden change in acceleration at the highest point.
Since a = dv/dt is constant, v must vary linearly with time: v(t) = v - g t.
At t = 0, v = +v (initial upward velocity, positive intercept).
At t = t/2 (roughly midway), the ball reaches its highest point, so v = 0 — the line crosses the t-axis there. …
- CBSE 2023Set ANNUAL1 markMCQQ.A football is kicked into the air vertically upwards with velocity u. The velocity of the ball at the highest point is(1) u(2) 2u(3) zero(4) 4u
›Reveal solutionSolution
At the highest point of vertical projectile motion, the velocity is instantaneously zero, since that is precisely the point where the upward motion stops and downward motion begins.
When the football is kicked straight up with velocity u, gravity decelerates it at g = 9.8 m/s^2 (downward). Using v = u - gt, the velocity decreases steadily until it becomes zero - this instant defines the 'highest point', because after this the velocity becomes negative (i.e. the ball starts moving downward). So by d …
- CBSE 2023Set ANNUAL1 markMCQQ.If an object is falling from a height of 20 m, then the time taken by the object to reach the ground : (ignore air resistance and take g = 10 ms^-2)(a) 2 s(b) 1.732 s(c) 1.532 s(d) 1.414 s
›Reveal solutionSolution
Using h = (1/2) g t^2 for a body falling from rest, t = sqrt(2h/g) = 2 s.
Given: h = 20 m, g = 10 m/s^2, initial velocity u = 0 (the object is falling, and we ignore air resistance).
Using the second equation of motion, …
- CBSE 2022Set TERM11 markMCQQ.Free fall of an object in vacuum is a case of motion with(1) uniform velocity(2) uniform acceleration(3) variable acceleration(4) uniform speed
›Reveal solutionSolution
With no air resistance to vary the net force, the only force on a freely falling object is gravity, which produces a constant acceleration g -- hence uniform (not variable) acceleration.
In vacuum, the only force acting on the falling object is its weight, mg, which is constant near the Earth's surface. By Newton's second law, acceleration = F/m = g, a constant value (~9.8 m/s^2) independent of the object's mass. Since this acceleration does not change with time, the motion is one …
- CBSE 2021Set TERM11 markMCQQ.A ball thrown by one player reaches the other in 2 sec. The maximum height attained by the ball above the point of projection will be (take g=10 ms^-2).(a) 10 m(b) 7.5 m(c) 5 m(d) 5.5 m
›Reveal solutionSolution
Total time of flight = 2 s, so time to reach the highest point = 1 s. At the highest point vertical velocity = 0, which gives initial speed u = g x 1 = 10 m/s, and then h = ut - (1/2)gt^2 = 5 m.
Since the ball leaves one player and reaches the other at (essentially) the same height, its up-and-down motion is symmetric about the highest point of the path. So:
time to rise to maximum height, t = T/2 = 2/2 = 1 s
…
- CBSE 2020Set ANNUAL1 markMCQQ.A ball is dropped from the top of a tower and reaches the ground in 4 seconds. The height of the tower is: (g = 10 m/s^2)(a) 40 m(b) 60 m(c) 80 m(d) 100 m
›Reveal solutionSolution
A dropped ball starts from rest, so its fall height follows h = (1/2) g t^2; plugging in t = 4 s gives 80 m.
…
🎓Unlock everything free for 14 days
- ✓Full step-by-step solutions
- ✓Concept-first explanations
- ✓Methods, shortcuts & mistakes
- ✓PYQ mapping + timed mock tests
Full access for 14 days. No credit card required.