Q.Explain Logistic growth or S-shaped curve or Sigmoid curve with a diagram.
You're viewing a preview — the full solution, concept, methods & PYQ mapping are locked.
Start your 14-day free trial to unlock the full solution →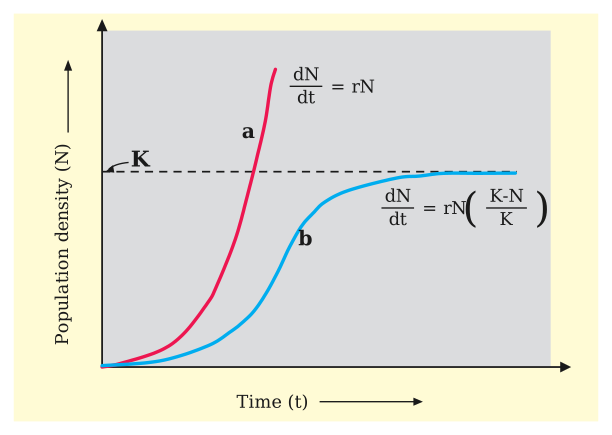
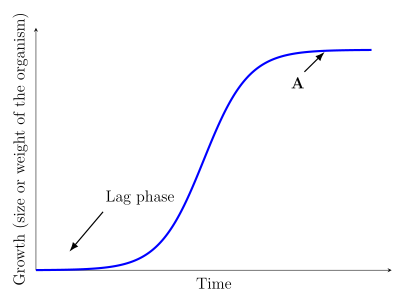
When resources are limited, population size grows slowly at first, then rapidly, then plateaus at the carrying capacity K, tracing out an S-shaped curve.
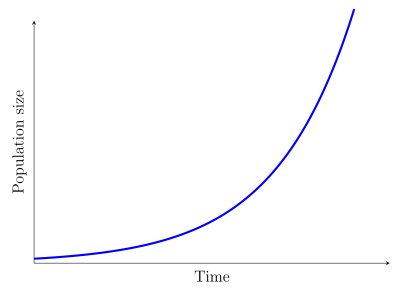
In a real habitat, resources (food, space) are always finite, so a population cannot go on growing exponentially forever. Under this realistic scenario, population growth follows the logistic (Verhulst-Pearl) growth model:
where N = population size, r = intrinsic rate of natural increase, and K = carrying capacity — the maximum population size the environment can sustainably support.
Phases of the curve (described, since no image was provided): plotting population size (N, Y-axis) against time (X-axis) gives an S-shaped (sigmoid) curve with three regions:
- Lag phase: growth is initially slow as the population is small. …
Unlock everything free for 14 days
- Full step-by-step solutions
- Concept-first explanations
- Methods, shortcuts & mistakes
- PYQ mapping + timed mock tests
Full access for 14 days. No credit card required.