Question 36 of 45
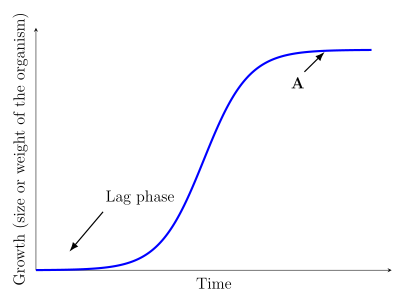
Q.Identify 'A' in the given graph of population growth (see figure):
Maharashtra MsbshseMaharashtra HSC (MSBSHSE) Board 2023Subjective· 1mImportance★★★★★
80% · 36/45 Questions
You're viewing a preview — the full solution, concept, methods & PYQ mapping are locked.
Start your 14-day free trial to unlock the full solution →'A' marks the plateau of the sigmoid growth curve, i.e. the carrying capacity (K) of the environment.
The sigmoid (S-shaped) or logistic growth curve has three broad phases: a slow lag phase when the population is small and growth is limited by the time needed for individuals to acclimatise and begin reproducing; an exponential phase where growth accelerates rapidly because resources are abundant; and finally a levelling-off as resource limitation (food, space, competition) increasingly checks the birth and death rates. The final plateau, marked 'A' in the graph, represents the …
Unlock everything free for 14 days
- Full step-by-step solutions
- Concept-first explanations
- Methods, shortcuts & mistakes
- PYQ mapping + timed mock tests
Full access for 14 days. No credit card required.