Biology · Ch 6 — Evolution
Hardy-Weinberg Principle
Hardy-Weinberg Principle
The Hardy-Weinberg Principle
In any population, you can calculate how often a particular allele of a gene appears. The Hardy-Weinberg principle states that, under ideal conditions, these allele frequencies remain constant from one generation to the next. This stable state is called genetic equilibrium. The principle uses simple algebra to express this idea.
The sum of all allele frequencies for a gene in a population equals 1. If a gene has two alleles, A and a, their frequencies are represented by p and q respectively. In a diploid organism, the frequency of individuals with genotype AA is simply p². This is because the probability that an A allele (with frequency p) appears on both chromosomes is p × p = p². Similarly, the frequency of aa individuals is q², and the frequency of Aa individuals is 2pq. This gives the equation:
p² + 2pq + q² = 1
This equation is the binomial expansion of (p + q)².
When the actual frequencies measured in a population differ from the expected values, the direction and size of the difference indicate the extent of evolutionary change. Any disturbance in this genetic equilibrium — a change in allele frequencies — is interpreted as evolution in action.
Factors That Affect Hardy-Weinberg Equilibrium
Five factors can disturb the equilibrium and cause evolution:
-
Gene migration or gene flow – When a section of a population migrates to another place, gene frequencies change in both the original and the new population. New alleles are added to the new population and lost from the old one. If this migration happens repeatedly, it is called gene flow.
-
Genetic drift – When allele frequency changes purely by chance, it is called genetic drift. Sometimes the change is so large in a small, isolated sample of a population that they become a different species. The original drifted population becomes the founders, and this effect is called the founder effect.
-
Mutation – Pre-existing advantageous mutations, when selected, result in new phenotypes. Over a few generations, this can lead to speciation.
-
Genetic recombination – Variation arising from recombination during gametogenesis also changes gene and allele frequencies in future generations.
-
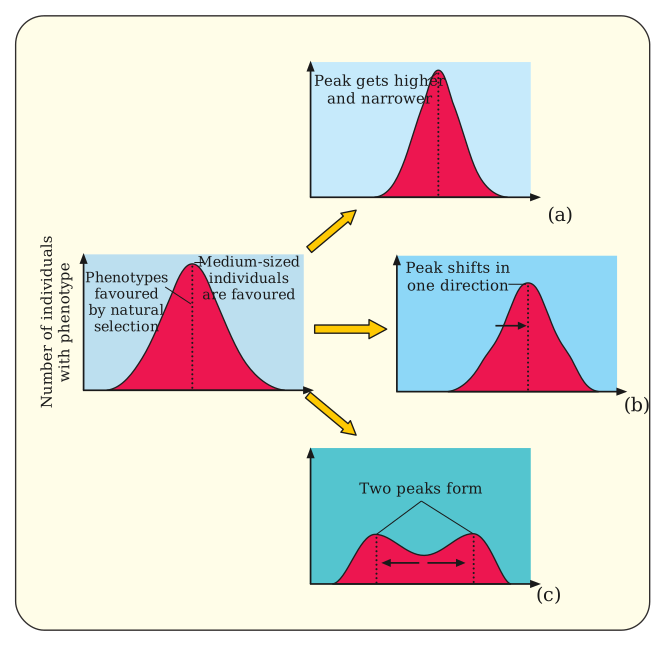
Natural selection – This is the process where heritable variations that enable better survival allow individuals to reproduce and leave a greater number of progeny. Natural selection can act in three ways: …
Drawn by us to help you understand the concept clearly, and verified to make sure it's accurate. For exams, practice from your textbook's own diagram.
Three panels, labelled (a), (b), and (c), each show a bell-shaped curve representing the frequency of a trait in a population. The horizontal axis of each graph runs from one extreme of the trait to the other; the vertical axis shows the number of individuals. In every panel, the original, unselected distribution is drawn as a dashed or lighter curve — a symmetrical bell centred on the mean.
Panel (a): Stabilising selection. The original bell curve is shown, and a narrower, taller solid curve is superimposed on it, centred at exactly the same mean. Arrows or shading indicate that individuals near the two extremes (the tails) are being removed, while those close to the mean survive and reproduce. The result: the curve becomes taller and narrower — the population’s trait variation decreases, but the average value stays the same.
Panel (b): Directional selection. The original bell curve is shown, and a solid curve is shifted entirely to one side — say, to the right. Arrows or shading show that individuals on the opposite extreme (the left tail) are eliminated, while those on the favoured extreme survive. The mean of the population moves in that direction; the curve’s shape may remain roughly bell-like, but its centre has clearly changed.
Panel (c): Disruptive selection. The original bell curve is shown, but instead of one solid curve, two separate peaks appear — one near each extreme, with a dip in the middle. Arrows or shading indicate that individuals near the centre (the mean) are removed, while those at both extremes are favoured. The original single bell splits into two distinct groups, increasing trait variation and potentially leading to two subpopulations. …