Applied Mathematics · Ch 8 — Index Numbers and Time-based Data
Trend Analysis by Moving Average Method
Trend Analysis by Moving Average Method
The moving average method draws a smooth curve through a time series by systematically averaging out the noise around the underlying trend. Rather than fit a formula, it works mechanically: each point on the trend curve is replaced with the average of the values immediately around it, which cancels out the cyclical, seasonal, and irregular variation in the series and leaves the smoother secular movement visible. Choosing the right length (or order) for the moving average matters — too short a window and noise survives in the trend; too long and genuine turning points get smoothed away.
For an odd-length window (say years), the procedure is straightforward:
- Add the values of the first 3 years and place this sum against the middle (median) year of that block — this is called the 3-year moving total.
- Drop the earliest year, bring in the next year, and repeat — sliding the 3-year block forward by one year each time and placing each new total against its own median year.
- Continue until every possible block of the data has been covered.
- Divide each moving total by to get the moving average — this is the trend value for that year.
Because each block needs a genuine middle year, this method leaves no trend value for the first and last periods of the series. …
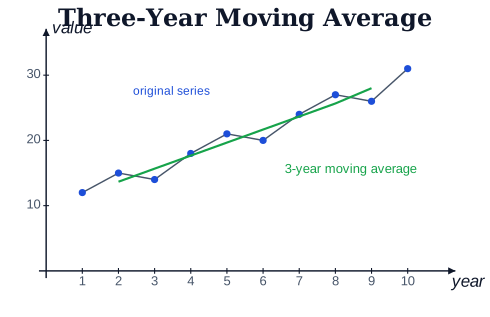
Drawn by us to help you understand the concept clearly, and verified to make sure it's accurate. For exams, practice from your NCERT textbook's own diagram.
A three-year moving average smooths short-term fluctuations, making the underlying tren …