Economics · Ch 9 — Production and Costs
Long Run Costs
Long Run Costs
3.7.2 Long Run Costs
The Nature of Long Run Costs
In the long run, every input a firm uses can be changed. There are no fixed inputs — no factory size that cannot be expanded, no machinery that cannot be replaced. Because nothing is fixed, there are no fixed costs either. Every cost the firm incurs is variable.
This means that in the long run, total cost and total variable cost are the same thing. There is no separate fixed-cost component to track. The firm's total cost is simply the sum of all payments it makes for all the inputs it hires.
Defining Long Run Average Cost and Long Run Marginal Cost
Long run average cost (LRAC) is the cost per unit of output when all inputs are variable. The formula is straightforward:
where is the total cost and is the quantity of output produced.
Long run marginal cost (LRMC) measures how much total cost changes when output changes by one unit. When we think in discrete units — say, increasing production from units to units — the marginal cost of producing the th unit is:
This is exactly the same logic as short run marginal cost, but now all costs are variable.
In the long run, total cost and total variable cost are identical. There is no fixed cost component. This is the fundamental difference from the short run.
Just as in the short run, the sum of all marginal costs up to any output level gives the total cost at that level. If you add up the LRMC for every unit from the first to the th, you get the total cost of producing units.
The Shapes of Long Run Cost Curves
The shape of the LRAC curve is determined by returns to scale — the behaviour of output when all inputs are increased proportionally. The textbook discusses three cases.
Increasing Returns to Scale (IRS) and Falling Average Cost
When IRS operates, increasing all inputs by a certain proportion causes output to increase by a larger proportion. To double output, for instance, you need to increase inputs by less than double. Since input prices are given, the cost of hiring those inputs also rises by less than double. What happens to average cost? If total cost rises by less than the increase in output, then cost per unit must fall. So as long as IRS operates, LRAC falls as output increases.
Decreasing Returns to Scale (DRS) and Rising Average Cost
When DRS operates, increasing all inputs by a certain proportion causes output to increase by a smaller proportion. To double output, you need to increase inputs by more than double. Cost therefore rises by more than the increase in output. Average cost must rise. So as long as DRS operates, LRAC rises as output increases.
Constant Returns to Scale (CRS) and Constant Average Cost
When CRS operates, a proportional increase in inputs leads to an exactly proportional increase in output. Cost and output rise in the same proportion, so average cost remains constant.
The textbook argues that a typical firm experiences IRS at low levels of output, then CRS, and finally DRS at high levels of output. This pattern is what gives the LRAC curve its characteristic U-shape.
The U-Shaped LRAC Curve
For a typical firm, the LRAC curve is U-shaped. The downward-sloping part corresponds to IRS — as output expands, average cost falls. The upward-sloping part corresponds to DRS — beyond some point, average cost begins to rise. At the minimum point of the LRAC curve, CRS is observed.
The LRMC Curve and Its Relationship with LRAC
For the very first unit of output, LRMC and LRAC are equal. After that, as output increases, LRAC initially falls. As long as average cost is falling, marginal cost must be less than average cost. When average cost is rising, marginal cost must be greater than average cost.
The LRMC curve is therefore also U-shaped. It cuts the LRAC curve from below at the minimum point of LRAC.
A common mistake is to think that when average cost is falling, marginal cost must also be falling. That is not true. Marginal cost can be rising and still be below average cost, pulling the average down. The only condition for falling average cost is that marginal cost is less than average cost — not that marginal cost itself is decreasing.
What Figure 3.9 Shows …
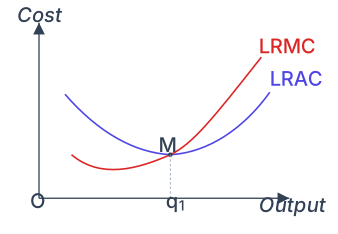
Drawn by us to help you understand the concept clearly, and verified to make sure it's accurate. For exams, practice from your NCERT textbook's own diagram.
The figure plots two curves on a standard cost-output diagram. The vertical axis is labelled Cost; the horizontal axis is labelled Output. The LRAC curve (long run average cost) is drawn in blue and is U-shaped — it falls initially, reaches a minimum, and then rises. The LRMC curve (long run marginal cost) is drawn in red and is also U-shaped, but it is steeper than the LRAC curve on both sides of the minimum.
The key geometric relationship is that the red LRMC curve cuts the blue LRAC curve from below at exactly the point where LRAC is at its lowest. That minimum point is labelled M. A dashed vertical line drops from M down to the output axis, marking the corresponding output level as q₁. To the left of q₁, the LRMC curve lies below the LRAC curve; to the right of q₁, LRMC lies above LRAC.
What this teaches is the fundamental relationship between marginal and average cost in the long run. Because all inputs are variable in the long run, there are no fixed costs — total cost and total variable cost are the same. The U-shape of LRAC reflects the pattern of returns to scale: the downward-sloping portion corresponds to increasing returns to scale (IRS), where average cost falls as output rises; the upward-sloping portion corresponds to decreasing returns to scale (DRS), where average cost rises. At the minimum point M, the firm experiences constant returns to scale (CRS). …