Informatics Practices · Ch 4 — Plotting Data using Matplotlib
Linewidth and Line Style
Linewidth and Line Style
The linewidth and linestyle properties let you control the thickness and visual pattern of a line in a Matplotlib chart. These are simple but powerful customisations that make your plots clearer and more professional.
Linewidth is measured in pixels. The default linewidth is 1 pixel, which produces a thin line. If you set linewidth to a number greater than 1, the line becomes thicker — the larger the number, the thicker the line. For example, linewidth=2 gives a line twice as thick as the default.
Linestyle controls the pattern of the line. You can set it using a string value. The accepted options are:
"solid"— a continuous line (this is the default)"dotted"— a line made of dots"dashed"— a line made of dashes"dashdot"— a line that alternates dashes and dots
These two properties are used together inside the plot() function. For instance, plt.plot(x, y, linestyle="dashed", linewidth=2) would draw a dashed line that is 2 pixels thick.
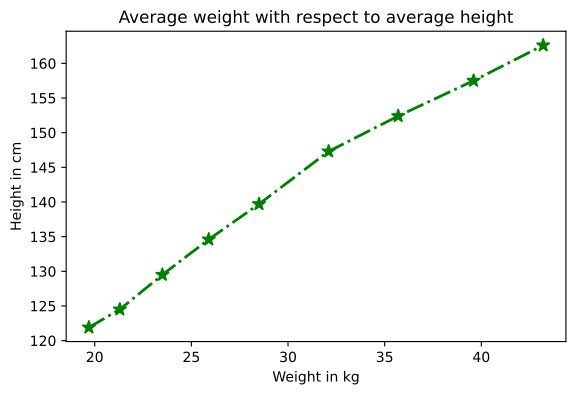
The textbook illustrates this with a complete program (Program 4-3). It uses two lists — height and weight — for persons aged 8 to 16. The data is first stored in a Pandas DataFrame with columns named "height" and "weight". Then the plot is created with the following specifications:
- x-axis: weight (labelled "Weight in kg")
- y-axis: height (labelled "Height in cm")
- line colour: green
- marker:
*(asterisk) - marker size: 10
- title: "Average weight with respect to average height"
- line style: dashed
- linewidth: 2 …
Plot average weight against average height for persons aged 8 to 16, with a green dashed line, star markers, marker size 10 and linewidth 2. This worked example demonstrates the marker, colour, linewidth and linestyl …
Drawn by us to help you understand the concept clearly, and verified to make sure it's accurate. For exams, practice from your NCERT textbook's own diagram.
Here the lesson moves from labelling to styling the line itself. Program 4-3 passes extra arguments to plot(): a marker ('*', drawn at every data point and sized with markersize), a colour (green), a linewidth of 2 and the 'dashdot' linestyle. The result — a green dash-dot line climbing steadily with a star at each of the ten weight/height pairs — demonstrates that each visual property of a line chart is controlled by its own named p …