Mathematics · Ch 7 — Applications of Differential Calculus
Extrema using First Derivative Test
Extrema using First Derivative Test
Once the intervals on which a function is increasing or decreasing are known, locating its relative extrema is straightforward using the following test.
Theorem 7.10 (First Derivative Test). Let be a critical point of , with continuous on an open interval containing and differentiable on except possibly at . Moving across from left to right:
- If changes from negative to positive at , then has a local minimum .
- If changes from positive to negative at , then has a local maximum .
- If is positive on both sides of , or negative on both sides of , then is neither a local minimum nor a local maximum. Working procedure (used throughout Exercise 7.6 Q2 and, later, Exercise 7.7 Q3):
- Find the critical numbers (solve ; note where is undefined).
- Tabulate the sign of on each interval between consecutive critical numbers (this simultaneously reads off the monotonicity — Theorem 7.7 — and feeds directly into the First Derivative Test).
- Classify each critical number using the sign-change pattern above, and compute the extreme value itself. …
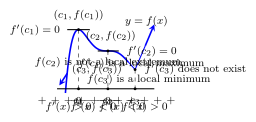
Drawn by us to help you understand the concept clearly, and verified to make sure it's accurate. For exams, practice from your textbook's own diagram.
What this figure shows. Schematic of the First Derivative Test: a curve with a local maximum at c1 (f'(c1)=0), a stationary non-extremum shoulder at c2 (f'(c2)=0), and a cusp local minimum at c3 (f'(c3) does not exist), above a sign number line marking f'(x) …
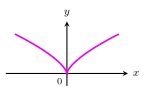
Drawn by us to help you understand the concept clearly, and verified to make sure it's accurate. For exams, practice from your textbook's own diagram.
What this figure shows. Graph of y = x^(2/3): an even function with a sharp cusp at the origin, strictly decreasing on (-infinity, 0) and strictly increasing on (0, infinity), with a local …
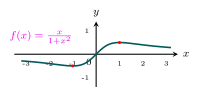
Drawn by us to help you understand the concept clearly, and verified to make sure it's accurate. For exams, practice from your textbook's own diagram.
What this figure shows. Graph of f(x) = x/(1+x^2): strictly decreasing on (-infinity,-1), increasing on (-1,1), decreasing on (1,infinity), with a local minimum (-1,-1/2) and a local …