Physics · Ch 11 — Dual Nature of Radiation and Matter
Effect of Intensity of Light on Photocurrent
Effect of Intensity of Light on Photocurrent
Effect of Intensity of Light on Photocurrent
The experimental setup for studying the photoelectric effect places the collector A at a positive potential relative to the emitter C. This potential difference creates an electric field that attracts the electrons ejected from C toward A, allowing them to be measured as a current.
The experiment proceeds by keeping two quantities fixed: the frequency of the incident radiation and the applied potential difference between emitter and collector. With these held constant, the intensity of the incident light is varied, and the resulting photoelectric current is measured for each intensity setting.
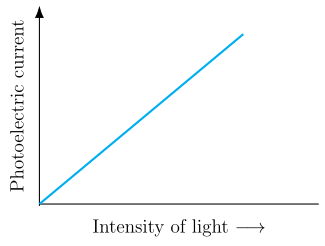
The results show a clear and direct relationship. As the intensity of the incident light increases, the photocurrent increases proportionally. When plotted on a graph with intensity on the horizontal axis and photocurrent on the vertical axis, the data points fall along a straight line passing through the origin. This linear relationship is shown in Fig. 11.2 of the textbook.
The photocurrent is directly proportional to the intensity of incident light when frequency and applied potential are held constant.
The physical meaning of this result is straightforward. The photocurrent measures the number of photoelectrons reaching the collector per second. Since the current increases linearly with intensity, the number of photoelectrons emitted per second must also increase linearly with intensity.
This observation leads to a fundamental conclusion about the nature of light-matter interaction at the quantum level. Each photon in the incident radiation carries a fixed amount of energy determined by its frequency. When the frequency is held constant, every photon has the same energy. Increasing the intensity means increasing the number of photons striking the emitter per second, not increasing the energy carried by each individual photon.
Intensity of light is defined as energy per unit area per unit time. For monochromatic light of fixed frequency, intensity is proportional to the number of photons per unit area per unit time.
Since each photon can eject at most one electron (provided its energy exceeds the work function), the number of photoelectrons emitted per second is directly proportional to the number of photons striking the surface per second. This explains why the photocurrent increases linearly with intensity.
A common misconception is that increasing intensity increases the energy of individual photons. This is incorrect — for fixed frequency, each photon's energy () remains constant. Only the number of photons changes with intensity.
The linear relationship between photocurrent and intensity holds only when the collector is at a sufficiently positive potential to collect all emitted electrons. If the potential is too low, some electrons may not reach the collector, and the relationship may deviate from linearity. The experiment is designed to avoid this by maintaining a positive potential that ensures all emitted electrons are collected. …
Drawn by us to help you understand the concept clearly, and verified to make sure it's accurate. For exams, practice from your textbook's own diagram.
The figure is a simple line graph, and its simplicity is the point. The horizontal axis is labelled Intensity of light (often denoted or for power per unit area). The vertical axis is labelled Photoelectric current (denoted or ). A single straight line begins at the origin and rises steadily to the right, showing that as the intensity of the incident light increases, the photoelectric current increases in exact proportion. The line is drawn in a deep indigo colour, but the colour is just a visual choice — the physics is in the straightness.
The physical idea this graph teaches is one of the cleanest results in the photoelectric effect: the number of photoelectrons emitted per second is directly proportional to the intensity of the incident radiation, provided the frequency of the light and the accelerating voltage (the potential between emitter and collector) are kept fixed. Each photon that strikes the metal surface can eject one electron, provided its energy exceeds the work function. When you increase the intensity — meaning you send more photons per second onto the surface — you get more photoelectrons per second. More electrons flowing per second means a larger current. The graph confirms that this relationship is linear: double the intensity, double the photocurrent.
The straight line through the origin tells you that photocurrent intensity at a fixed frequency and fixed collector potential. This is a direct experimental verification that each photon ejects at most one electron — the photocurrent is a count of electrons, not a measure of their energy.
The key formula that emerges from this figure is the relation for the photoelectric current:
where:
- is the photoelectric current (in amperes, A),
- is the number of photoelectrons emitted per second (in s),
- is the elementary charge ( C).
Since the graph shows (intensity), and is a constant, it follows that . The number of photoelectrons per second is directly proportional to the intensity of the incident light.
A common mistake is to think that increasing intensity increases the energy of the emitted electrons. It does not. The graph shows only the number of electrons (current) increasing. The maximum kinetic energy of the electrons depends only on the frequency of the light and the work function of the metal — not on how bright the light is. That result comes from a different graph (the stopping potential vs. frequency plot). …