Physics · Ch 11 — Dual Nature of Radiation and Matter
Effect of Potential on Photoelectric Current
Effect of Potential on Photoelectric Current
The Experiment: How Collector Potential Affects Photoelectric Current
The setup is straightforward. You have an emitter plate C (the photocathode) and a collector plate A, both inside an evacuated tube. A battery connected between them allows you to control the potential of A relative to C — positive or negative. You shine light of a fixed frequency and a fixed intensity onto plate C, and measure the current that flows from C to A.
Step 1: Positive (accelerating) potential. You start by making plate A positive with respect to C. This positive potential pulls the emitted photoelectrons toward A. As you gradually increase this positive potential, the photocurrent increases. Why? Because more of the emitted electrons are being successfully collected before they can scatter or be pulled back. At some point, you reach a potential where every single electron emitted from C is collected by A. Beyond this point, increasing the positive potential further does not increase the current — the current has reached its maximum value. This maximum is called the saturation current.
Saturation current is a direct measure of the number of photoelectrons emitted per second. If you double the intensity of light, you double the saturation current — because more photons mean more electrons ejected per second.
Step 2: Negative (retarding) potential. Now you reverse the battery polarity, making plate A negative with respect to C. This negative potential repels the negatively charged electrons. Only those electrons with enough kinetic energy to overcome this repulsion can reach A. As you make the negative potential more and more negative (i.e., increase the retarding voltage), the photocurrent drops sharply. Eventually, at a specific, sharply defined negative potential , the current falls to exactly zero. This critical value is the stopping potential (or cut-off potential).
The stopping potential is not the potential at which the current merely becomes small — it is the sharply defined value at which the current just becomes zero. This sharpness tells us that the most energetic photoelectrons all have the same maximum kinetic energy for a given frequency of incident light.
The Key Relationship: Stopping Potential and Maximum Kinetic Energy
The stopping potential is the minimum retarding potential that stops even the fastest photoelectrons. The work done by the electric field in stopping an electron of charge is . This work must equal the maximum kinetic energy of the emitted electrons. Therefore:
This is equation (11.1) in the textbook. It is a direct, quantitative link between an easily measured voltage and the energy of the most energetic photoelectrons.
The stopping potential is a direct measure of the maximum kinetic energy of the photoelectrons. If you know , you know — no further calculation needed beyond multiplying by the electron charge .
The Effect of Changing Light Intensity
Now repeat the entire experiment — first with positive potential, then with negative — using the same frequency of light but a higher intensity , and then an even higher intensity (where ). What do you observe?
For positive potentials: The saturation current is larger for higher intensities. This makes sense: more intense light means more photons per second, which means more electrons ejected per second, so the maximum possible current is higher.
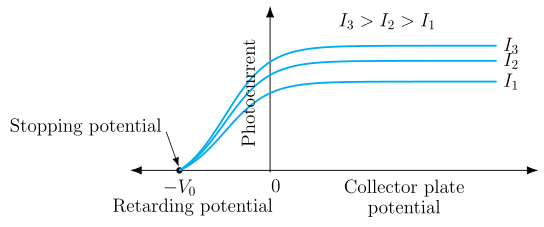
For negative potentials: The stopping potential is exactly the same for all three intensities. The graph of photocurrent versus collector potential for different intensities shows three curves that all meet the voltage axis at the same point .
This is a profound result. The maximum kinetic energy of the photoelectrons depends only on the frequency of the incident light and the material of the emitter — not on how bright the light is. Doubling the intensity gives you twice as many electrons, but each one has the same energy distribution as before. …
Drawn by us to help you understand the concept clearly, and verified to make sure it's accurate. For exams, practice from your textbook's own diagram.
Fig. 11.3 is a graph that captures the entire story of how photocurrent behaves when you change the voltage on the collector plate, and it does so for three different light intensities at the same frequency.
The horizontal axis is the collector plate potential . The origin is at the centre: to the right, (accelerating potential, pulling electrons toward the collector); to the left, (retarding potential, pushing electrons back). The vertical axis is the photoelectric current , the number of electrons reaching the collector per second.
Three curves are drawn, one for each intensity . All three share a critical feature: they each drop to zero current at exactly the same negative voltage, labelled . This common point is the stopping potential. No matter how bright the light is, if you make the collector sufficiently negative — to — even the fastest photoelectrons cannot reach it, and the current becomes zero. That is the first major lesson: for a fixed frequency of incident light, the stopping potential does not depend on intensity.
As you move the voltage to the right (less negative, then positive), each curve rises from zero at , climbs through the origin, and eventually flattens into a horizontal plateau. That plateau is the saturation current. At these large positive voltages, every electron that is emitted from the cathode is swept to the collector — no electrons are lost. The saturation current is therefore a direct measure of how many electrons are emitted per second. The three plateaus sit at different heights: the highest intensity gives the largest saturation current, gives a middle value, and gives the smallest. This shows that the number of photoelectrons emitted per second is proportional to the intensity of the incident light.
The stopping potential is the same for all three intensities. This tells us that the maximum kinetic energy of the emitted electrons depends only on the frequency of the light (and the metal), not on how bright the light is.
The key formula that emerges directly from this figure is:
Here:
- is the maximum kinetic energy of any photoelectron just after it leaves the metal surface.
- is the magnitude of the electron’s charge ( C).
- is the stopping potential — the magnitude of the negative voltage that just barely stops the fastest electron.
The reasoning is straightforward: the retarding potential does work on an electron. To stop the most energetic electron, that work must exactly equal its initial kinetic energy. So . The figure makes this concrete: you read off the graph where the current hits zero, and that single number gives you the maximum energy of the photoelectrons, regardless of how intense the light is. …