Physics · Ch 13 — Oscillations
Energy in Simple Harmonic Motion
Energy in Simple Harmonic Motion
13.7 Energy in Simple Harmonic Motion
When a particle oscillates in simple harmonic motion, it continuously exchanges energy between two forms: kinetic energy (due to its motion) and potential energy (due to its displacement from equilibrium). The total mechanical energy of the system remains constant, because no dissipative forces like friction are assumed to act. This conservation of energy is a direct consequence of the fact that the restoring force in SHM is conservative.
We begin by writing the displacement and velocity of a particle executing SHM. Let the motion be described by:
where is the amplitude, is the angular frequency, and is the initial phase. The velocity is the time derivative of displacement:
Kinetic Energy ()
The kinetic energy of a particle of mass is . Substituting the expression for velocity:
Since (where is the force constant), we can also write . Therefore:
This shows that kinetic energy varies sinusoidally with time, reaching its maximum value when , i.e., when the particle passes through the equilibrium position (). The maximum kinetic energy is:
Potential Energy ()
The potential energy stored in a spring (or any system obeying Hooke's law) when displaced by from equilibrium is the work done against the restoring force. Since the restoring force is , the work done to displace the particle from to is:
Substituting :
The potential energy is maximum when , i.e., at the extreme positions . The maximum potential energy is:
Notice that .
Total Mechanical Energy ()
The total mechanical energy is the sum of kinetic and potential energies at any instant:
Since for any angle , we get:
This is a constant, independent of time. The total energy depends only on the force constant and the amplitude . It does not depend on the mass or the phase .
Variation of and with Displacement
It is often useful to express kinetic and potential energies directly in terms of displacement , rather than time. Using and the identity , we get:
These forms make the energy conservation explicit:
The table below summarises the values of , , and at key positions:
| Position () | Kinetic Energy () | Potential Energy () | Total Energy () |
|---|---|---|---|
| (equilibrium) | |||
| (extremes) | |||
At , the kinetic and potential energies are equal. This is a useful checkpoint.
A common mistake is to think that total energy changes with time because and individually change. They do change, but their sum remains constant. The energy is not lost; it is merely transferred between kinetic and potential forms.
Graphical Representation
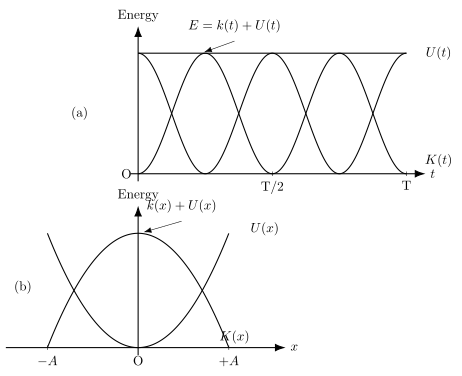
If we plot , , and against displacement , we get the following picture:
- is a parabola: , opening upward with its vertex at .
- is an inverted parabola: , opening downward, with its maximum at and zero at .
- is a horizontal straight line at height , tangent to the curve at and to the curve at .
The horizontal line always lies above both and curves, and the sum of the vertical distances from the -axis to the and curves at any equals the height of the line.
The potential energy curve is the same as the potential energy of a spring. The motion is confined between and because outside this range, the required total energy would exceed , which is impossible.
Energy and the Amplitude
Since , the amplitude is directly related to the total energy. If the oscillator is given more energy (e.g., by pulling the spring further), the amplitude increases proportionally to the square root of the energy: …
Drawn by us to help you understand the concept clearly, and verified to make sure it's accurate. For exams, practice from your textbook's own diagram.
The figure is split into two panels, each telling you something different about the same physical truth: in SHM, total mechanical energy is constant, while kinetic and potential energy trade places perfectly.
Panel (a): Energy versus time
The horizontal axis is time , the vertical axis is energy. A straight horizontal line runs across the plot at height , the constant total mechanical energy. Two oscillating curves sit below it: one for potential energy and one for kinetic energy . Both curves are smooth, starting from opposite extremes — when one is at its maximum, the other is at zero. Each curve completes a full cycle from zero to maximum and back to zero in a time interval of , where is the period of the SHM. This is half the period of the displacement itself, because energy depends on the square of displacement or velocity.
The physical idea is direct: at the extreme positions (), the particle is momentarily at rest, so and all energy is potential, . At the equilibrium position (), speed is maximum, so and . In between, the two curves cross at the point where .
Panel (b): Energy versus displacement
The horizontal axis is displacement , ranging from to . The vertical axis is again energy. The total energy is a horizontal line. The potential energy curve is an upward-opening parabola, zero at and rising to at . The kinetic energy curve is an inverted parabola, maximum at and falling to zero at . At every , the sum equals the constant .
The two panels show the same conservation law from different angles: time evolution (panel a) and spatial dependence (panel b). Both confirm that .
The central formulas that the textbook develops with this figure are:
Here is the force constant (spring constant), is the amplitude, and is the displacement from equilibrium. The first formula is the potential energy of a spring. The second comes from , using . The third is the total mechanical energy, which depends only on and , not on or . …