Q.Plot a graph between resistivity (ρ) and absolute temperature (T) for copper.
🔒You're viewing a preview — the full solution, concept, methods & PYQ mapping are locked.
🔒 Start your 14-day free trial to unlock the full solution →Concept understanding — Temperature Dependence of Resistance
Temperature Dependence of Resistance
Imagine you're trying to walk through a crowded market. When the market is cool and calm, people move slowly and you can weave through easily. Now imagine the same market on a hot, chaotic day — everyone is jostling, moving faster, bumping into each other. Getting from one end to the other becomes much harder.
That's exactly what happens inside a metal wire when you heat it up.
The Intuition
In a metal, electric current is carried by free electrons drifting through a fixed lattice of positive ions. At room temperature, these ions are vibrating slightly around their positions. When you heat the metal, the ions vibrate more vigorously — they shake faster and with larger amplitude.
Think of the vibrating ions as a row of swinging doors. At low temperature, the doors barely move, so electrons slip through easily. At high temperature, the doors swing wildly, and electrons get knocked off course constantly. Each collision with a vibrating ion scatters the electron, making it harder for the current to flow.
The result: resistance increases as temperature increases — for most conductors.
The Precise Statement
For a metallic conductor over a moderate temperature range (not too close to absolute zero), the resistance changes linearly with temperature:
R(T)=R0[1+α(T−T0)]
Where:
- R(T) is the resistance at temperature T
- R0 is the resistance at a reference temperature T0 (often 0∘C or 20∘C)
- α is the temperature coefficient of resistance (units: per °C or per K)
R=R0(1+αΔT)
The coefficient α tells you how sensitive the material is to temperature changes. For copper, α≈0.0039/∘C — meaning for every 1°C rise, resistance increases by about 0.39%.
What About Other Materials?
Not everything behaves like metals.
Semiconductors (like silicon, germanium) do the opposite: their resistance decreases sharply as temperature rises. Why? Because heating frees more electrons from their bonds, creating many more charge carriers. Even though the lattice vibrates more, the huge increase in available carriers overwhelms that effect, so resistance drops.
Insulators also show decreasing resistance with temperature, but the effect is much smaller than in semiconductors.
Alloys like constantan (copper-nickel) have a very small α — their resistance barely changes with temperature. This is useful for making precision resistors that stay stable.
Superconductors are a special case: below a critical temperature, resistance drops to exactly zero. …
Why this formula?
Temperature Dependence of Resistance — Why the Formula Holds
Let’s build this from the ground up. The key formula you’ll see in exams is:
RT=R0(1+αT)
But why does resistance change with temperature? It’s not magic — it’s about what happens inside the wire.
1. What determines resistance?
Resistance R of a conductor depends on three things:
- Length L (longer → more resistance)
- Cross-sectional area A (thicker → less resistance)
- Resistivity ρ — a material property
The formula is:
R=ρAL
When temperature changes, L and A change very slightly (thermal expansion), but the big effect is on ρ.
2. Why does resistivity change with temperature?
Resistivity ρ depends on how easily electrons can move through the material.
- In metals: Atoms vibrate more as temperature rises. These vibrations scatter electrons, making it harder for them to flow. So ρ increases.
- In semiconductors: More electrons get enough energy to jump into the conduction band. So ρ decreases.
For most metals (and many conductors), the change is linear over a moderate temperature range.
3. Deriving the linear formula
Let ρ0 be resistivity at a reference temperature T0 (often 0∘C or 20∘C).
For a small change ΔT=T−T0, the change in resistivity is proportional to ΔT and to ρ0:
Δρ∝ρ0ΔT
Introduce the temperature coefficient of resistivity α:
Δρ=αρ0ΔT
So the new resistivity is:
ρ=ρ0+Δρ=ρ0(1+αΔT)
Now, since R=ρAL, and L and A change negligibly (for small ΔT), we get:
R=ρAL=ρ0(1+αΔT)AL=R0(1+αΔT)
That’s the formula:
RT=R0(1+αΔT)
Where:
- RT = resistance at temperature T
- R0 = resistance at reference temperature T0
- α = temperature coefficient of resistance (unit: ∘C−1 or K−1)
- ΔT=T−T0
--- …
For a metal like copper, the free-electron density stays essentially constant with temperature, so what changes — and drives its resistivity up — is the rate at which those electrons get scattered by the increasingly vigorous lattice vibrations. …
For a metal like copper, resistivity rises almost linearly with absolute temperature over the normal range, since more thermal vibrations of the lattice increase electron scattering.
Copper is a good conductor whose free-electron density is essentially constant with temperature; what changes with temperature is the rate at which conduction electrons are scattered by vibrating lattice ions (phonons), and this scattering rate increases roughly linearly with absolute temperature T over the usual range of temperatures. So a plot of resistivity rho (y-axis) against absolute temperature T (x-axis) for copper is a curve that rises almost linearly with a positive slope, starting from a small positive value of rho at very low T (due to residual/impurity scattering) rather than pa …
Showing the 12 most recent of 28 on this concept.
- CBSE 2026Set ANNUAL1 markQ.Plot a graph between resistivity (ρ) and absolute temperature (T) for copper.
›Reveal solutionSolution
For a metal like copper, resistivity rises almost linearly with absolute temperature over the normal range, since more thermal vibrations of the lattice increase electron scattering.
Copper is a good conductor whose free-electron density is essentially constant with temperature; what changes with temperature is the rate at which conduction electrons are scattered by vibrating lattice ions (phonons), and this scattering rate increases roughly linearly with absolute temperature T over the usual range of temperatures. So a plot of resistivity rho (y-axis) against absolute temperature T (x-axis) for copper is a curve that rises almost linearly with a positive slope, starting from a small positive value of rho at very low T (due to residual/impurity scattering) rather than pa …
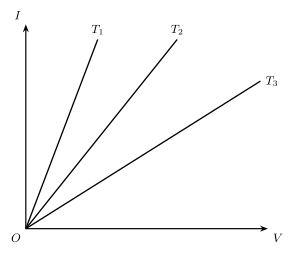
- CBSE 2026Set SEM31 markMCQQ.Given figure shows I – V curve of a metal wire at three different temperatures T₁, T₂ and T₃. In this case, we can come to a conclusion that(a) T₁ > T₂ > T₃(b) T₁ < T₂ < T₃(c) T₁ = T₂ = T₃(d) T₁ = T₂ > T₃
›Reveal solutionSolution
For an I–V graph, slope = I/V = 1/R. The steepest line has the least resistance, and metals have resistance increasing with temperature, so the steepest line = lowest temperature: T₁ < T₂ < T₃. Option (b).
Step 1 — from Ohm's law V = IR, the slope of an I-versus-V straight line equals 1/R.
Step 2 — T₁ has the steepest slope → smallest resistance; T₃ has the least steep slope → largest resistance (so R₃ > R₂ > R₁).
…
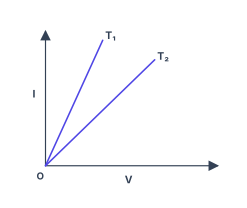
- CBSE 2025Set 55/6/11 markMCQQ.The figure shows the voltage (V) versus the current (I) graphs for a wire at two temperatures T1 and T2. One can conclude that: (A) T2=2T1 (B) T1>T2 (C) T1=T2/3 (D) T1<T2
›Reveal solutionSolution
For a metallic wire, resistance increases with temperature. On the printed graph the current I is on the vertical axis and voltage V on the horizontal axis, so each line's slope is I/V=1/R — a steeper line means a smaller resistance. The line for T1 is the steeper one, so T1 has the smaller resistance and hence the lower temperature: T1<T2.
The key idea is Ohm's law: V=IR. On the printed graph the current I is plotted on the vertical axis against the voltage V on the horizontal axis, so the slope of each line is I/V=1/R. A steeper slope therefore means a smaller resistance.
For a metal, resistance increases as temperature rises — the lattice ions vibrate more vigorously and scatter the conduction electrons more often. So a higher temperature means a higher resistance and (with I on the vertical axis) a less steep line.
Figure — 55/6/1 Q1 Now look at the figure. Both lines are straight and pass through the origin — the wire obeys Ohm's law at both temperatures. The line labelled T1 has the larger slope. That means:
- Slope of T1 line > slope of T2 line.
- Since slope =1/R, we have RT1<RT2. …
- CBSE 2025Set D1 markMCQQ.With the rise in temperature, the resistance of semiconductor (A) increases (B) decreases (C) sometimes increases and sometimes decreases (D) remains unchanged
›Reveal solutionSolution
A semiconductor's resistance decreases with rising temperature (negative temperature coefficient).
In a semiconductor, raising the temperature supplies enough thermal energy to break more covalent bonds, promoting electrons across the band gap. This sharply increases the number density of free charge carriers (electrons and holes). Although the carriers' mobility falls slightly, the large increase in car …
- CBSE 2025Set ANNUAL1 markMCQQ.Which of the following substance have negative temperature coefficient of resistance?(a) metal(b) metal and semiconductor(c) semiconductor(d) metal and alloy
›Reveal solutionSolution
A semiconductor's resistance falls (and conductivity rises) as temperature increases — a negative temperature coefficient.
Metals and alloys have a positive temperature coefficient of resistance — their resistance increases with temperature, since increased lattice vibration increases electron scattering. Semiconductors behave oppositely: as temperature rises, many more charge carriers are thermally excited across the (small) forbidden energy gap, so the number of free carri …
- CBSE 2025Set ANNUAL1 markMCQQ.How does the resistance of a conductor vary as a function of temperature ?(a) remain same(b) decrease(c) increase(d) first increase then decrease
›Reveal solutionSolution
For a metallic conductor, resistance increases as temperature rises.
The resistivity ρ of a metallic conductor increases with temperature. As temperature rises, the lattice ions vibrate more vigorously, so free electrons collide with them more often. This reduces the average relaxation time τ between collisions, and since ρ=ne2τm, a smaller τ means a larger ρ. Since R=ρAl, resistance rises along with resistivity. This is u …
- CBSE 2025Set ANNUAL1 markMCQQ.The specific resistance of a conductor increases with –(a) decrease in length(b) increase in temperature(c) increase in cross sectional area(d) decrease in cross sectional area
›Reveal solutionSolution
Resistivity is a material property that depends on temperature, not on the conductor's dimensions.
Specific resistance (resistivity, ρ) depends only on the nature/material of the conductor and its temperature — it does NOT depend on length or cross-sectional area (those affect resistance R=ρl/A, not ρ itself). As temperature increases, increased lattice vibrations reduce the relaxation time τ of free elec …
- CBSE 2024Set A1 markQ.Write True or False: Resistivity of semiconductors increases with increase in temperature.
›Reveal solutionSolution
Semiconductors have a negative temperature coefficient of resistivity — resistivity falls as temperature rises.
For conductors (metals), resistivity increases with temperature because increased thermal vibrations of the lattice scatter the (roughly constant number of) free electrons more.
…
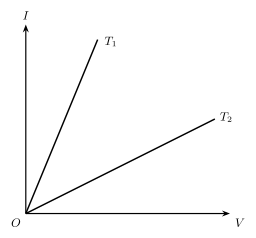
- CBSE 2024Set ANNUAL1 markMCQQ.The current-voltage (I-V) graphs for a given metallic wire at two temperatures T1 and T2 are shown in Fig. (Q. No. 4). Then :(a) T1 = T2(b) T1 > T2(c) T2 > T1(d) None of the above
›Reveal solutionSolution
The slope of an I–V graph is 1/R; since a metal's resistance rises with temperature, the flatter (less steep) line belongs to the hotter sample.
For a metallic conductor, I = V/R, so on an I-versus-V graph the slope of the straight line equals 1/R.
- Line T1 is steeper → larger slope → smaller resistance R(T1).
- Line T2 is less steep → smaller slope → larger resistance R(T2). …
- CBSE 2024Set ANNUAL1 markMCQQ.The resistance of a bulb-filament is 100 Ω at a temperature of 100°C. If the temperature coefficient of the resistance be 0.005/°C, its resistance will become 200 Ω at a temperature of(a) 200°C(b) 300°C(c) 400°C(d) 500°C.
›Reveal solutionSolution
Using the linear temperature-resistance relation with the given reference resistance at 100°C, the bulb reaches 200 Ω at 300°C.
For a conductor whose resistance varies (nearly) linearly with temperature, taking the resistance R0=100Ω at the reference temperature t0=100°C as the base:
Rt=R0[1+α(t−t0)]
where α=0.005 per °C is the temperature coefficient of resistance and t is the required temperature.
…
- CBSE 2024Set ANNUAL1 markMCQQ.Si and Cu are cooled from 300K to a temperature of 60K. Then resistivity -(a) for Si increases and for Cu decreases(b) for Cu increases and for Si decreases(c) decreases for both Si and Cu(d) increases for both Si and Cu
›Reveal solutionSolution
Metals and semiconductors respond oppositely to cooling: a metal's resistivity falls, a semiconductor's resistivity rises.
Resistivity depends on the number of free charge carriers and how often they collide with the lattice.
- Copper (metal): Free electrons are already abundant (fixed by the metal's structure) and don't change much with temperature. Cooling reduces lattice vibrations, so electrons collide less often — resistivity decreases. …
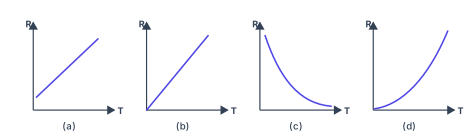
- CBSE 2023Set 55/1/11 markMCQQ.For a metallic conductor, the correct representation of variation of resistance R with temperature T is :(a)(b)(c)(d)
›Reveal solutionSolution
For a metallic conductor, resistance increases with temperature. Under the idealised formula R=R0(1+αT) taught for calculations, this is a straight line with a positive R-intercept — option (a). Some released answer-key sources for this exact question instead cite option (d), a slightly curved rise; we could not independently confirm which is the official CBSE key.
Figure — CBSE 2023 55/1/1 Q2: four R vs T option graphs (a)-(d) Why resistance increases with temperature in metals
In a metallic conductor, current flows because free electrons drift through the lattice of positive ions. As temperature rises, these ions vibrate more vigorously around their equilibrium positions. The increased thermal motion creates more frequent collisions between the drifting electrons and the vibrating lattice, impeding the flow of charge. This is why resistance increases with temperature for metals — a defining characteristic that distinguishes them from semiconductors (where resistance decreases with temperature as more charge carriers become available).
The quantitative relationship most often used for calculations is:
R=R0(1+αT)
where R0 is the resistance at T=0∘C, α is the temperature coefficient (positive for metals, typically ∼10−3K−1), and T is the temperature in Celsius.
Analyzing the graph options
-
The mathematical form tells us the shape.
The equation R=R0(1+αT) is linear in T. Rearranging: R=R0+R0αT. This is a straight line with slope R0α>0 and y-intercept R0>0.
-
Eliminate the decreasing curve.
Option (c) shows resistance decreasing with temperature. This is characteristic of semiconductors or thermistors, not metallic conductors. Ruled out immediately.
-
Distinguish between the rising options.
- Option (b): A straight line through the origin. This would mean R=0 when T=0, implying R0=0 — physically incorrect. A metal has finite resistance even at absolute zero (ignoring superconductivity).
- Option (d): A concave-up curve that rises ever more steeply. This does not match the idealised linear formula, though it is closer to how NCERT's own resistivity-vs-temperature figure for a real metal is actually drawn (not perfectly straight).
- Option (a): A straight line with a positive R-intercept. This matches R=R0+R0αT exactly.
-
Physical interpretation of the intercept. …
-
🎓Unlock everything free for 14 days
- ✓Full step-by-step solutions
- ✓Concept-first explanations
- ✓Methods, shortcuts & mistakes
- ✓PYQ mapping + timed mock tests
Full access for 14 days. No credit card required.