Q.Draw a graph between angle of incidence
🔒You're viewing a preview — the full solution, concept, methods & PYQ mapping are locked.
🔒 Start your 14-day free trial to unlock the full solution →Concept understanding — Angle of Minimum Deviation and Refractive Index of Prism
Plotting deviation d against angle of incidence i1 for a prism gives a curve that falls to a single minimum value D (the angle of minimum deviation) before rising again; at this minimum the ray path through the prism is symmetric, with the incident and emergent angles equal (i1=i2=i), the two internal refraction angles equal (r1=r2=r=A/2, since r1+r2=A), and the ray inside the prism running parallel to its base. Substituting i1=i2=i, r1=r2=A/2 and i=(A+D)/2 (from D=2i−A) into Snell's law $n=\sin i/\sin …
As the angle of incidence on a prism is increased from grazing incidence, the angle of deviation first decreases, reaches one minimum value (minimum deviation), and then increases again — giving a single-minimum, roughly U-shaped curve. …
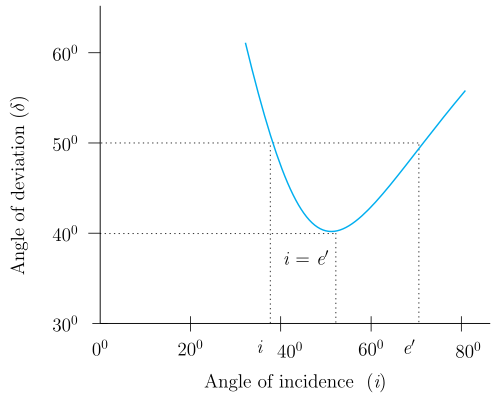
As the angle of incidence on a prism is increased from grazing incidence, the angle of deviation first decreases, reaches one minimum value (minimum deviation), and then increases again — giving a single-minimum, roughly U-shaped curve.
For a triangular prism, if the angle of incidence i is varied continuously and the corresponding angle of deviation δ is measured, plotting δ (y-axis) against i (x-axis) gives a curve with the following features:
- At small i (near grazing incidence) δ is large.
- As i increases, δ decreases, reaching a single minimum value δm (the angle of minimum deviation) at some particular angle of incidence.
- Beyond that point, as i increases further, δ increases again. …
Showing the 12 most recent of 13 on this concept.
- CBSE 2026Set V11 markMCQQ.The angle of minimum deviation of a prism depends on :(i) refractive index of the material of the prism(ii) refractive index of surrounding medium(iii) refracting angle of the prism(a) Only option(i)(b) Only option(ii)(c) Only option(iii)(d) All (i),(ii) and (iii)
›Reveal solutionSolution
(d) All (i), (ii) and (iii) …
- CBSE 2026Set ANNUAL1 markMCQQ.The graph between angle of incidence(i) and angle of deviation (δ) for a triangular prism is(a) graph: monotonically decreasing curve, flattening out (shown in the original paper)(b) graph: straight line increasing linearly from origin (shown in the original paper)(c) graph: U-shaped curve with a minimum (shown in the original paper)(d) graph: straight line decreasing linearly (shown in the original paper)
›Reveal solutionSolution
The angle-of-deviation vs angle-of-incidence graph for a prism is U-shaped: deviation falls to a minimum value (the angle of minimum deviation, where i = e) and then rises again.
As the angle of incidence i on a prism is increased from a small value, the deviation delta first decreases, reaches a single minimum value delta_m at the position of symmetric passage through the prism (where the angle of incidence equals the angle of emergence, i = e), and then increases again as i is increased further. This non-monoton …
- CBSE 2026Set ANNUAL1 markQ.If the angle of minimum deviation of an equilateral prism is 39.5∘, find the refractive index of the material of the prism.
›Reveal solutionSolution
The prism formula relates the refractive index to the angle of minimum deviation and the prism angle; substituting A=60∘ (equilateral) and Dm=39.5∘ gives μ≈1.53.
The prism (minimum-deviation) formula
For light passing through a prism of angle A at the angle of minimum deviation Dm, the refractive index of the prism material is
μ=sin(2A)sin(2A+Dm)
Given values
Since the prism is equilateral, A=60∘. We are given Dm=39.5∘.
…
- CBSE 2025Set IMPROVEMENT1 markMCQQ.What is the angle of minimum deviation for a prism made of a material with refractive index n and a very small prism angle A?(a) (n+1)A(b) (n-1)A(c) (n−1)(n+1)A(d) (n+1)(n−1)A
›Reveal solutionSolution
For a thin prism (small angle A), the minimum deviation is δm=(n−1)A.
For a prism of refracting angle A and refractive index n, the general relation for minimum deviation is n=sin2Asin(2A+δm). When the prism angle A is very small, the angle of minimum deviation δm is also small, so the sines can be replaced by the angles themselves ( …
- CBSE 2024Set A1 markQ.In which position does the refracted ray inside the prism become parallel to the prism base?
›Reveal solutionSolution
At minimum deviation, the ray path inside the prism is symmetric and runs parallel to the base.
As the angle of incidence on a prism is varied, the angle of deviation first decreases, reaches a minimum value δm, and then increases again. At this position of minimum deviation, the refracted ray inside the prism travels symmetrically with respect to the two refracting surfaces — the angle of incidence equals the angle of emergence (i1=i2), and correspondingly r1=r2=A/2 (A = prism angle). Unde …
- CBSE 2024Set ANNUAL1 markMCQQ.If the refractive index of a material of equilateral prism is √3, then angle of minimum deviation of the prism is :(a) 30°(b) 45°(c) 60°(d) 75°
›Reveal solutionSolution
Substitute A = 60° (equilateral prism) and n = √3 into the prism formula and solve for δm.
For a prism, refractive index and minimum deviation are related by:
n=sin(2A)sin(2A+δm)
For an equilateral prism, A=60∘, and n=3:
3=sin30∘sin(260∘+δm)=0.5sin(260∘+δm) …
- CBSE 2023Set BS1 markMCQQ.What will be the refractive index of a thin prism material if its refracting angle and angle of deviation are the same?i) 1.5ii) 2.0iii) 1.33iv) 0 (zero)
›Reveal solutionSolution
Using δ=(n−1)A with δ=A gives n=2.
For a thin prism the angle of deviation is related to the prism angle by δ=(n−1)A, where n is the refractive index and A the refracting angle. The condition given is that the deviation equals t …
- CBSE 2023Set ANNUAL1 markMCQQ.For an angle of incidence 'i' on an equilateral prism of refractive index √3, the ray refracted is parallel to the base inside the prism. The value of 'i' is –(a) 30°(b) 45°(c) 60°(d) 90°
›Reveal solutionSolution
When the refracted ray inside an equilateral prism runs parallel to the base, the path is symmetric, so the angle of refraction at the first face is exactly half the prism angle.
Why: For an equilateral prism, apex angle A=60∘. A ray travelling parallel to the base inside the prism is the special symmetric case of minimum deviation, where the angle of refraction at the first surface equals the angle of incidence at the second surface: r1=r2=A/2=30∘.
Steps: …
- CBSE 2022Set I1 markMCQQ.The refractive index of material of the Prism is (A) μ = sin(A + δ_m)/sin(A/2) (B) μ = sin(A/2)/sin(A + δ_m) (C) μ = sin((A + δ_m)/2)/sin(A/2) (D) μ = sin(A/2)/sin((A + δ_m)/2)
›Reveal solutionSolution
Prism formula: μ=sin(2A)sin(2A+δm).
For a prism of refracting angle A, when the light passes symmetrically the deviation is minimum, δm. Under this condition the refractive index of the prism material is
μ=sin(2A)sin(2A+δm).
…
- CBSE 2022Set ANNUAL1 markQ.Draw a graph between angle of incidence(i) and angle of deviation (delta) for a triangular prism.
›Reveal solutionSolution
Figure — Stem asks for the i vs delta graph for a triangular prism; the catalog figure is exactly the plot of angle of As the angle of incidence on a prism is increased from grazing incidence, the angle of deviation first decreases, reaches one minimum value (minimum deviation), and then increases again — giving a single-minimum, roughly U-shaped curve.
For a triangular prism, if the angle of incidence i is varied continuously and the corresponding angle of deviation δ is measured, plotting δ (y-axis) against i (x-axis) gives a curve with the following features:
- At small i (near grazing incidence) δ is large.
- As i increases, δ decreases, reaching a single minimum value δm (the angle of minimum deviation) at some particular angle of incidence.
- Beyond that point, as i increases further, δ increases again. …
- CBSE 2020Set 55/1/11 markQ.A ray of light on passing through an equilateral glass prism, suffers a minimum deviation equal to the angle of the prism. The value of refractive index of the material of the prism is ___________ .
›Reveal solutionSolution
For an equilateral prism (A=60∘), minimum deviation δm=A is given. Using the prism formula n=sin(A/2)sin[(A+δm)/2], we get n=sin30∘sin60∘=3≈1.732.
Why compare angles? The core idea
When a ray passes through a prism with minimum deviation, the path is symmetric — the ray enters and exits at equal angles. This symmetry simplifies the geometry drastically. Here, we are told that the minimum deviation equals the prism angle itself. That is a special condition, and it directly pins down the refractive index.
The standard prism formula connects refractive index n, prism angle A, and minimum deviation δm:
n=sin(2A)sin(2A+δm)
This formula comes from applying Snell’s law at both faces under symmetric conditions. We just need to plug in the numbers.
Step-by-step
-
Identify the given data.
The prism is equilateral, so its angle is A=60∘.
The minimum deviation equals the prism angle: δm=A=60∘.
-
Substitute into the prism formula.
n=sin(260∘)sin(260∘+60∘)=sin30∘sin(2120∘)=sin30∘sin60∘
- Evaluate the sines. sin60∘=23, and sin30∘=21. So:
n=2123=3
- Interpret the result. …
-
- CBSE 2018Set ANNUAL1 markMCQQ.The angle of prism is 60°, angle of deviation is 30°, incident angle is i and emergent angle is e. For angle of minimum deviation the values of i and e will be:(a) i = 45°, e = 30°(b) i = 30°, e = 45°(c) i = 45°, e = 45°(d) i = 30°, e = 30°
›Reveal solutionSolution
At minimum deviation the ray passes symmetrically through the prism, so i = e = (A + D_min)/2.
For a prism of angle A, deviation is minimum when the ray travels symmetrically through the prism — the angle of incidence i equals the angle of emergence e, and the two refraction angles inside the prism are equal: r1=r2=A/2.
…
🎓Unlock everything free for 14 days
- ✓Full step-by-step solutions
- ✓Concept-first explanations
- ✓Methods, shortcuts & mistakes
- ✓PYQ mapping + timed mock tests
Full access for 14 days. No credit card required.