Applied Mathematics · Ch 10 — Descriptive Statistics
Frequency Polygon
Frequency Polygon
A frequency polygon is a line graph that gives you the same information as a histogram, but in a cleaner, more continuous form. Instead of bars, you plot points at the midpoints (class marks) of each class interval, at the height of the corresponding frequency, and then join these points with straight lines. This makes it especially useful for comparing two or more data sets on the same axes, since the overlapping lines are far easier to read than overlapping bars. The polygon is closed by bringing the line down to the horizontal axis at the midpoints …
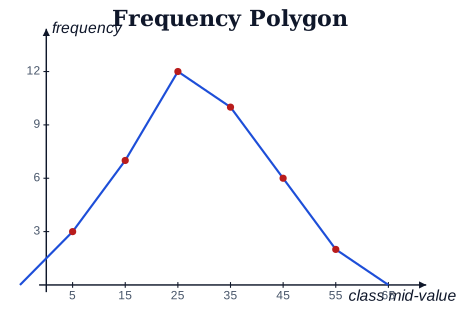
Drawn by us to help you understand the concept clearly, and verified to make sure it's accurate. For exams, practice from your NCERT textbook's own diagram.
A frequency polygon joins the plotted class mid-values; it is closed to the axi …