Computer Science · Ch 4 — Introduction to Problem Solving
Flowchart — Visual Representation of Algorithms
Flowchart — Visual Representation of Algorithms
A flowchart is a visual representation of an algorithm: a diagram made up of boxes, diamonds and other shapes connected by arrows. Each shape stands for one step of the solution process, and each arrow shows the order of — the link between — the steps. The shapes are not chosen freely; standardised symbols exist for drawing flowcharts (ovals for start/end, rectangles for processes, diamonds for decisions, parallelograms for input/output, arrows for flow — see Table 4.1 in section 4.4).
Example 4.1 — algorithm to find the square of a number
Before developing any algorithm, first pin down the input, process and output:
- Input: the number whose square is required
- Process: multiply the number by itself to obtain the square
- Output: the square of the number
The algorithm follows directly:
Step 1: Input a number and store it in num
Step 2: Compute num * num and store it in square
Step 3: Print square
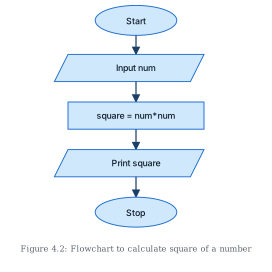
The same algorithm can be represented pictorially as a flowchart (Figure 4.2): a straight top-to-bottom chain — Start (oval) → Input num (parallelogram) → square = num * num (rectangle) → Print square (parallelogram) → Stop (oval). Because there are no decisions, no diamond appears and no path ever branches: every run of this algorithm performs exactly the same steps in the same order.
Think about it …
Drawn by us to help you understand the concept clearly, and verified to make sure it's accurate. For exams, practice from your NCERT textbook's own diagram.
Figure 4.2 is the flowchart form of Example 4.1's algorithm for finding the square of a number. It is a simple linear flowchart read top to bottom, with every arrow vertical and unlabelled — the visual signature of pure sequence, where each step follows the previous one with no branching.
The five nodes, in order:
- An oval (terminator) labelled Start — where the flow begins.
- A parallelogram (input) labelled Input num — the number to be squared is read from the user and stored in
num. - A rectangle (process) labelled square = num*num — the single computation step: the number is multiplied by itself and the result stored in
square. - A parallelogram (output) labelled Print square — the computed square is displayed.
- An oval (terminator) labelled Stop — where the flow ends.
The arrows run straight down: Start → Input num → square = num*num → Print square → Stop. …
Drawn by us to help you understand the concept clearly, and verified to make sure it's accurate. For exams, practice from your NCERT textbook's own diagram.
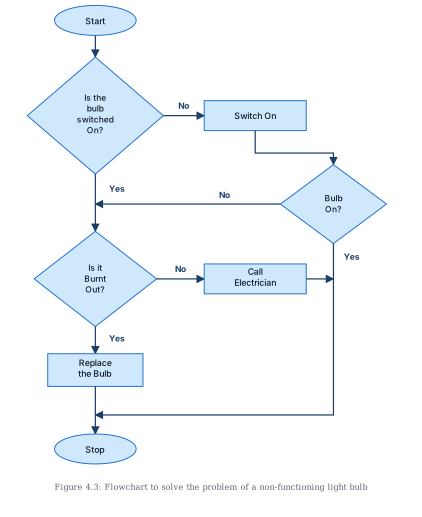
Figure 4.3 answers Example 4.2 — a flowchart for diagnosing a light bulb that is not working. Unlike the straight-line chart of Figure 4.2, this one branches, using three decision diamonds whose Yes/No exits steer the flow along different paths.
The chart reads as follows:
- An oval 'Start' at the top leads down to the first diamond: "Is the bulb switched On?"
- If No, an arrow goes right to a rectangle 'Switch On' — the obvious first remedy. From 'Switch On' the flow drops to a second diamond: "Bulb On?" which asks whether switching it on fixed the problem.
- If Yes (the bulb now works), a long vertical line runs down toward the bottom of the chart — nothing more needs doing.
- If No, the arrow goes left and merges into the main downward line, so the diagnosis continues.
- If the first diamond's answer was Yes (the bulb was already switched on yet not glowing), the flow descends directly down that same vertical line.
- The merged line reaches the third diamond: "Is it Burnt Out?"
- If Yes, the flow drops to a rectangle 'Replace the Bulb' — a burnt-out bulb is simply replaced.
- If No (switched on, not burnt out, still not working), the arrow goes right to a rectangle 'Call Electrician' — the fault must lie elsewhere and needs an expert. Its exit runs across and joins the vertical line coming down from "Bulb On? Yes".
- All paths — bulb fixed by switching on, bulb replaced, electrician called — converge on a merge line that leads into the oval 'Stop' at the bottom-left. …
| Flowchart symbol | Function | Description |
|---|---|---|
| (rounded rectangle / stadium shape) | Start/End | Also called “Terminator” symbol. It indicates where the flow starts and ends. |
| (rectangle) | Process | Also called “Action Symbol,” it represents a process, action, or a single step. |
| (diamond) | Decision | A decision or branching point, usually a yes/no or true/false question is asked, and based on the answer, the path gets split into two branches. |