Applied Mathematics · Ch 7 — Inferential Statistics
Statistical Significance and Sampling Distribution
Statistical Significance and Sampling Distribution
A finding is called statistically significant when we're confident it's real — that it didn't arise from sampling error alone but reflects something genuinely true about the population, provided the sample itself was drawn sensibly. Whether an observed result clears that bar is decided using statistical hypothesis testing (covered next); the more significant a result, the more reliable it's considered.
To reason about significance rigorously, statisticians rely on the idea of a sampling distribution — a theoretical construct, never actually built in practice. Imagine repeatedly drawing samples of the same fixed size from a population, computing a statistic (say, the mean) for each one, and plotting a histogram of all those computed values. The distribution that histogram would approach is the sampling distribution of that statistic.
This idea connects directly to the Central Limit Theorem (CLT): no matter what shape the population's own distribution has, the sampling distribution of the mean approaches a normal (bell-shaped) curve as the sample size grows, provided all samples are the same size. A sample size of 30 or more is generally considered large enough for the CLT to hold well, and as grows further, estimates of the population's characteristics become increasingly accurate.
As sample size increases, the sample mean converges toward the true population mean, and its sampling distribution becomes normal — regardless of what the underlying population distribution looks like. …
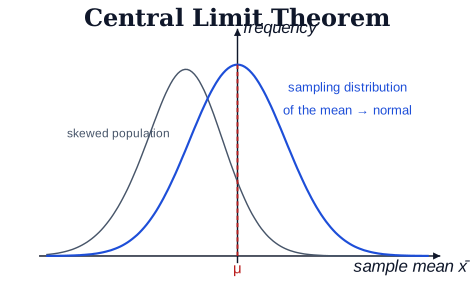
Drawn by us to help you understand the concept clearly, and verified to make sure it's accurate. For exams, practice from your NCERT textbook's own diagram.
By the Central Limit Theorem the sampling distribution of the mean approaches a normal curve centred on μ, even when the …