Question 50 of 54
Q.Draw the chart of Relative Contribution of green house gases.
Tamil Nadu DgeTamil Nadu HSC (DGE) Board 2025Subjective· 3mImportance★★★★★
93% · 50/54 Questions
You're viewing a preview — the full solution, concept, methods & PYQ mapping are locked.
Start your 14-day free trial to unlock the full solution →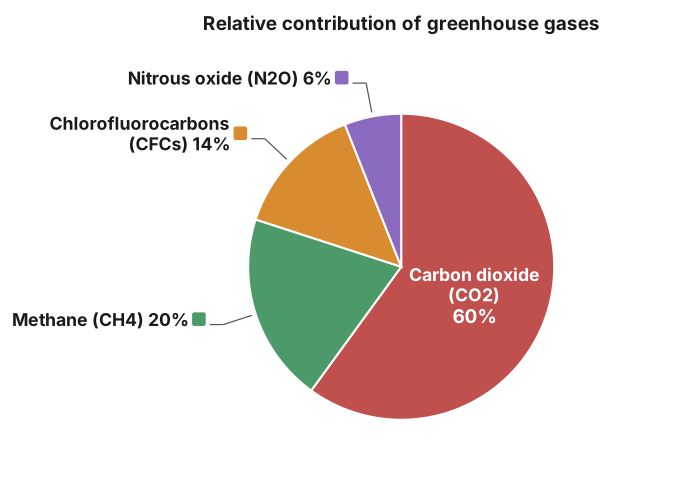
The commonly cited relative contribution of greenhouse gases to global warming is approximately CO2 60%, methane 20%, CFCs 14%, and nitrous oxide 6%, usually shown as a pie chart.
Since an actual chart/diagram cannot be rendered here, its content is described so it can be reproduced as a labelled pie chart:
Draw a circle (pie chart) and divide it into four sectors, sized and labelled according to each gas's approximate share of the overall (enhanced) greenhouse effect:
- Carbon dioxide (CO2) -- approximately 60% of the circle, the largest sector, reflecting that CO2 (released mainly by fossil-fuel combustion, deforestation, and industrial processes) is emitted in by far the greatest quantity of all greenhouse gases, even though it is individually less potent, molecule for molecule, than some other gases.
- Methane (CH4) -- approximately 20% of the circle, the second-largest sector, released from sources such as paddy fields, livestock digestion, and landfills; methane traps heat far more effectively per molecule than CO2, but is present in much smaller quantities.
- Chlorofluorocarbons (CFCs) -- approximately 14% of the circle, released from older refrigerants, aerosols, and foam-blowing agents; CFCs are extremely potent greenhouse gases (and also ozone-depleting) despite being released in relatively small amounts. …
Unlock everything free for 14 days
- Full step-by-step solutions
- Concept-first explanations
- Methods, shortcuts & mistakes
- PYQ mapping + timed mock tests
Full access for 14 days. No credit card required.