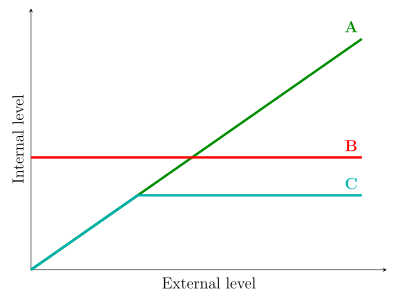
Q.The figure given below is a diagrammatic representation of response of organisms to abiotic factors, plotting Internal level against External level and showing three curves labelled A, B and C. What do A, B and C represent respectively?
S.No. | A | B | C
a. | Conformer | Regulator | Partial Regulator
b. | Regulator | Partial Regulator | Conformer
c. | Partial Regulator | Regulator | Conformer
d. | Regulator | Conformer | Partial Regulator
You're viewing a preview — the full solution, concept, methods & PYQ mapping are locked.
Start your 14-day free trial to unlock the full solution →Step 1. Interpret curve A. Curve A rises continuously in step with the external level across the whole range — the organism's internal condition simply mirrors the external environment. This is the defining behaviour of a conformer (e.g., most aquatic invertebrates, many plants), which does not expend energy on maintaining a constant internal state.
Step 2. Interpret curve B. Curve B stays essentially flat no matter how much the external level changes — the organism actively maintains a constant internal environment (homeostasis) despite external fluctuation. This is the defining behaviour of a regulator (e.g., birds and mammals maintaining constant body temperature).
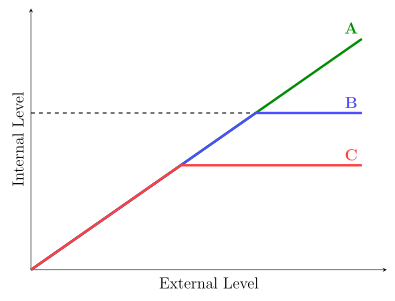
Step 3. Interpret curve C. Curve C tracks the external level at first (like a conformer) but then levels off and stays constant beyond a certain external value. This mixed behaviour — regulating only over part of the range and conforming over the rest — is characteristic of a partial regulator. …
Unlock everything free for 14 days
- Full step-by-step solutions
- Concept-first explanations
- Methods, shortcuts & mistakes
- PYQ mapping + timed mock tests
Full access for 14 days. No credit card required.