Q.During decomposition of an activated complex (Two or more than two options may be correct.)
🔒You're viewing a preview — the full solution, concept, methods & PYQ mapping are locked.
🔒 Start your 14-day free trial to unlock the full solution →Concept understanding — Arrhenius Equation Plot
The Arrhenius Equation Plot: Why Temperature Changes Reaction Speed
You already know that heating things up makes reactions go faster. A cold chai takes forever to dissolve sugar; hot chai does it in seconds. But how much faster? And is there a pattern that holds for every reaction?
That pattern is the Arrhenius equation, and plotting it in a clever way reveals something fundamental about how molecules need to collide to react.
The core idea: an energy barrier
Imagine a ball sitting in a valley. To get to the next valley, it must first be pushed up over a hill. That hill is the activation energy (Ea) — the minimum energy two molecules need to have when they collide, for the reaction to happen.
At a low temperature, most molecules move slowly. Only a tiny fraction have enough energy to climb that hill. Raise the temperature, and suddenly many more molecules have the required energy. The fraction of molecules with energy ≥Ea is given by the Boltzmann distribution:
fraction=e−Ea/RT
where R is the gas constant and T is the absolute temperature (in Kelvin). This exponential is the heart of the story.
The Arrhenius equation (precise statement)
The rate constant k of a reaction depends on temperature as:
k=Ae−Ea/RT
- k = rate constant (how fast the reaction proceeds)
- A = pre-exponential factor (frequency of collisions, times a steric factor — how often molecules hit in the right orientation)
- Ea = activation energy (J/mol or kJ/mol)
- R = 8.314 J/(mol·K)
- T = temperature in Kelvin
k is not the reaction rate itself — it's the proportionality constant in the rate law. But for a fixed concentration, a larger k means a faster reaction.
Why plot it? The linear trick
The equation k=Ae−Ea/RT is exponential in 1/T. That's hard to eyeball. But take the natural logarithm of both sides:
lnk=lnA−REa⋅T1
This is the equation of a straight line:
y=c+mx
where:
- y=lnk
- x=1/T
- slope m=−Ea/R
- intercept c=lnA
So if you measure k at several temperatures and plot lnk versus 1/T, you get a straight line — provided the reaction follows Arrhenius behaviour (most do, over moderate temperature ranges).
Always use Kelvin for T. Celsius will give you a curved mess because 1/T is not linear in Celsius.
What the plot tells you
From the slope, you get Ea:
Ea=−(slope)×R
A steep negative slope means a large Ea — the reaction is very sensitive to temperature. A shallow slope means a small Ea — temperature doesn't affect it much.
From the intercept, you get A:
A=eintercept
This tells you about the collision frequency and orientation factor. A high A means molecules are colliding often and in the right geometry.
A typical Arrhenius plot looks like this
| T (K) | k (s⁻¹) | 1/T (K⁻¹) | lnk |
|---|---|---|---|
| 300 | 0.0012 | 0.00333 | -6.72 |
| 310 | 0.0028 | 0.00323 | -5.88 |
| 320 | 0.0061 | 0.00313 | -5.10 |
| 330 | 0.0125 | 0.00303 | -4.38 |
Plot lnk (y-axis) vs 1/T (x-axis). The points fall on a straight line. Draw the best-fit line, measure its slope, and compute Ea. …
Why this formula?
Arrhenius Equation Plot: Why It Holds
The Arrhenius equation is not a guess — it emerges from a deep physical picture of how molecules react. Let's build that understanding step by step.
The Core Idea: Molecules Need Energy to React
For a reaction to occur, molecules must collide with enough energy to break existing bonds and form new ones. This minimum energy is called the activation energy (Ea).
But not all collisions succeed — only those with kinetic energy ≥Ea lead to a reaction.
The Key Formula
The Arrhenius equation is:
k=Ae−Ea/(RT)
Where:
- k = rate constant
- A = pre-exponential factor (frequency of collisions with correct orientation)
- Ea = activation energy (J/mol)
- R = gas constant (8.314 J/mol·K)
- T = absolute temperature (K)
Why the Exponential Term Appears
Step 1: The Boltzmann Distribution
Molecules in a gas or liquid have a distribution of kinetic energies. The fraction of molecules with energy ≥E is given by the Boltzmann factor:
Fraction=e−E/(kBT)
For molar quantities, replace kB with R:
Fraction=e−Ea/(RT)
This is not arbitrary — it comes from statistical mechanics. The exponential arises because the probability of a molecule having energy E decreases exponentially as E increases.
Step 2: Rate Depends on This Fraction
The rate constant k is proportional to:
- The collision frequency (how often molecules meet)
- The fraction of collisions with energy ≥Ea
Thus:
k∝(collision frequency)×e−Ea/(RT)
The collision frequency is captured by A, giving:
k=Ae−Ea/(RT)
Why the Plot is Linear
Take the natural logarithm of both sides:
lnk=lnA−REa⋅T1
This is of the form y=mx+c, where:
- y=lnk
- x=1/T
- Slope m=−Ea/R
- Intercept c=lnA
Thus, plotting lnk vs 1/T gives a straight line — this is the Arrhenius plot.
What the Slope Tells Us
From the slope: …
The key idea is that an activated complex (transition state) sits at the top of the energy barrier — higher in energy than both the reactants and the products.
Step 1: The activated complex is formed by absorbing the activation energy as reactants climb to the top of the barrier.
Step 2: Once at the peak, the complex is unstable and immediately decomposes — either forward toward products or backward toward reactants. …
An activated complex (transition state) sits at the highest-energy point along the reaction coordinate — above BOTH the reactants and the products. Whichever way it decomposes (forward to products, or backward to reactants), the system moves downhill from that peak, so energy is always released. The complex can equally well fall back to re-form the original reactants. The correct options are (i) and (iv).
1. What is an activated complex?
In transition state theory, the activated complex is the fleeting, high-energy arrangement of atoms that exists at the top of the potential energy barrier along the reaction coordinate. It is not a stable species — old bonds are partly broken and new bonds are partly formed at the same time. Crucially, it sits at a potential energy MAXIMUM relative to both reactants and products on either side of it.
2. What happens when it decomposes?
"Decomposition" here means the complex breaks apart and the system moves away from that energy peak — either forward, converting to products, or backward, reverting to reactants.
- Moving forward (complex → products): the system descends from the peak to the product energy level, so energy is released.
- Moving backward (complex → reactants): the system descends from the same peak back down to the reactant energy level, so energy is released here too.
Because the activated complex is higher in energy than both reactants and products, any direction it decomposes in involves a drop in potential energy — so energy is always released during decomposition. This is why option (i) is correct, and why options (ii) "energy is always absorbed" and (iii) "energy does not change" are both wrong: energy absorption happens while the reactants are climbing UP to form the complex (that absorbed energy is the activation energy), not while the complex is decomposing. …
Concept: Activated Complex (Transition State) in Chemical Reactions
The activated complex (or transition state) is a high-energy, unstable arrangement of atoms that exists at the peak of the potential energy barrier between reactants and products. It is not a stable molecule — it exists only for an instant and then decomposes to form either products or back to reactants.
Method: Energy Profile Analysis
Name of method: Potential Energy Surface / Reaction Coordinate Analysis
Steps:
-
Draw the reaction coordinate diagram
- Plot potential energy (y-axis) vs reaction progress (x-axis).
- The curve rises from reactants to a peak (the activated complex), then falls to products.
-
Identify the activated complex
- It is at the maximum of the curve — the highest energy point.
-
Analyze decomposition direction
- The complex can decompose forward → products (energy decreases).
- The complex can decompose backward → reactants (energy decreases again).
- In both cases, the system moves downhill in energy.
-
Conclude about energy change
- Since the activated complex is at a local maximum, any decomposition (forward or backward) results in a decrease in energy. …
Here’s a breakdown of the common mistakes students make on this question, along with how to avoid each.
The Core Concept: The Activated Complex (Transition State)
The activated complex (or transition state) is a high-energy, unstable arrangement of atoms that exists at the peak of the potential energy barrier in a chemical reaction. It is not a stable molecule; it exists only for an instant.
- It can decompose forward to form products.
- It can decompose backward to reform reactants.
The key is that the activated complex has higher energy than both the reactants and the products. Therefore, when it decomposes in either direction, energy is released as it moves down the energy hill.
Common Mistake #1: Assuming energy is always absorbed
The Error: Students think that because the activated complex is "activated" (high energy), breaking it down must require more energy input. They confuse the formation of the complex (which requires energy) with its decomposition.
Why it’s wrong: The activated complex is at a local energy maximum. Any movement away from this peak — whether toward reactants or products — involves a decrease in potential energy. A decrease in potential energy means energy is released (usually as heat or kinetic energy of the molecules).
How to Avoid: Draw the energy profile diagram. Mark the activated complex at the top. Ask yourself: "If I am at the top of a hill, which way do I go to lose energy?" The answer is any direction. Decomposition always releases energy.
Common Mistake #2: Thinking energy does not change
The Error: Students assume that because the complex is unstable and short-lived, its decomposition is "instantaneous" and involves no energy change.
Why it’s wrong: The very definition of the activated complex is that it sits at a potential energy maximum. Moving away from that maximum must involve a change in energy (a decrease). "No change" would imply it is at a flat plateau, which is not the case for a true transition state. …
Showing the 12 most recent of 25 on this concept.
- TG EAPCET 2026Set ap-2026-05-04-AN1 markMCQQ.If the radius of orbit x of He+ (Z = 2) is 238.05 pm, then the energy of the same orbit (in kJ) is (A) +9.68×10⁻²² (B) −9.68×10⁻²² (C) 4.34×10⁻²¹ (D) −4.34×10⁻²⁴
›Reveal solutionSolution
For a hydrogen-like ion, the radius and energy of an orbit are linked through the Bohr model. Using the given radius of He⁺, we find the principal quantum number n, then compute the energy. The energy of that orbit is −9.68×10⁻²² kJ.
The key idea here is that for any hydrogen-like species (one electron around a nucleus of charge Ze), the Bohr model gives exact expressions for both the radius and the energy of the nth orbit. The radius depends on n2/Z, and the energy depends on Z2/n2. If you know one, you can find the other.
The problem gives the radius of an orbit of He⁺ (Z=2) as 238.05 pm. That number is not arbitrary — it should match a specific n value. Once n is known, the energy follows directly. Let’s work through it.
- Recall the Bohr radius formula for a hydrogen-like ion. The radius of the nth orbit is
rn=Zn2a0
where a0=52.9 pm is the Bohr radius (the radius of the first orbit in hydrogen). For He⁺, Z=2, so
rn=2n2×52.9 pm
- Plug in the given radius and solve for n. We have rn=238.05 pm. Thus
238.05=2n2×52.9
Multiply both sides by 2:
476.1=n2×52.9
Divide by 52.9:
n2=52.9476.1=9
So n=3. The orbit is the third Bohr orbit of He⁺.
TipYou could also notice that 238.05 pm is exactly 4.5×52.9 pm, and 4.5=9/2, so n2=9 immediately. Spotting such ratios saves time in exams.
- Now find the energy of the nth orbit for He⁺. The energy of a hydrogen-like ion in the nth orbit is
En=−13.6×n2Z2 eV
For He⁺ (Z=2) and n=3:
E3=−13.6×94 eV=−13.6×94 eV
Compute:
−13.6×94=−954.4=−6.0444… eV …
- TG EAPCET 2026Set ap-2026-05-05-FN1 markMCQQ.At T(K), decomposition of A(g) follows first order kinetics The following data is obtained for this reaction
[!FORMULA] Time(s)0100Total pressure (in atm)0.50.6
What is the rate constant (in s−1) of this reaction? (log(1.25) = 0.097; log(1.666) = 0.222) (A) 2.23×10⁻³ (B) 5.11×10⁻³ (C) 2.23×10⁻⁴ (D) 5.11×10⁻⁴›Reveal solutionSolution
For a first-order gas-phase decomposition, the total pressure increases as the reactant decomposes. Using the relation between total pressure and partial pressure of the reactant, we apply the first-order integrated rate law to find k=2.23×10⁻³s−1.
The key idea here is that the total pressure in a constant-volume system is not the same as the concentration of the reactant — but for a gas-phase reaction, partial pressure is directly proportional to concentration. So we can track the reaction by converting the measured total pressure into the partial pressure of A at any time.
The reaction is:
A(g)→products (assume stoichiometry like A→B+C or similar, typical for first-order decomposition where moles increase).
Let’s work through it step by step.
-
Write the reaction and initial conditions.
Suppose A(g) decomposes as A(g)→B(g)+C(g) (or any number of product gases). At t=0, only A is present, so initial pressure PA(0)=0.5 atm. Total pressure at t=0 is also 0.5 atm.
-
Relate total pressure to partial pressure of A.
Let the initial pressure of A be P0=0.5 atm. At time t, let x be the amount (in atm) of A that has decomposed. Then:
- Partial pressure of A remaining: PA=P0−x
- If the reaction produces, say, 1 mole of B and 1 mole of C per mole of A, then partial pressures of products are x each.
- Total pressure: Ptotal=(P0−x)+x+x=P0+x
So x=Ptotal−P0.
-
Find PA at t=100 s.
Given Ptotal=0.6 atm at t=100 s, we have:
x=0.6−0.5=0.1 atm
Therefore:
PA(100)=P0−x=0.5−0.1=0.4 atm
- Apply the first-order rate law. For a first-order reaction, the integrated rate law in terms of pressure (since P∝ concentration at constant T and V) is:
k=t1lnPAP0
Substitute t=100 s, P0=0.5, PA=0.4:
k=1001ln0.40.5=1001ln(1.25)
- Use the given log value. …
-
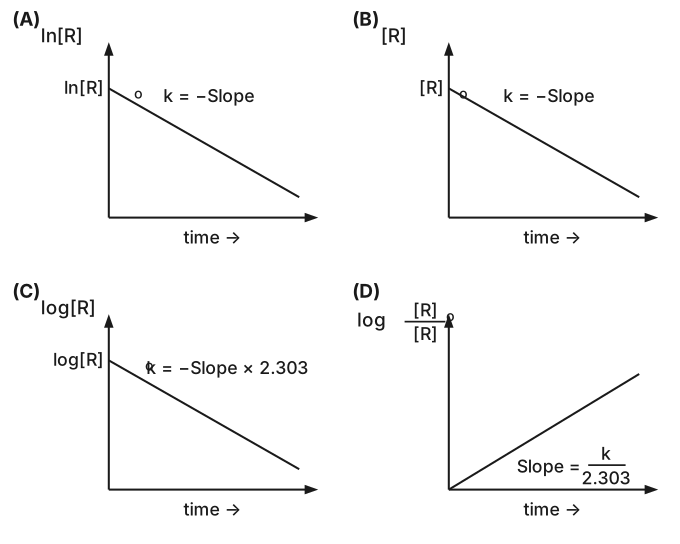
- TG EAPCET 2025Set eng-2025-05-02-FN1 markMCQQ.For the reaction RP, half life is independent of initial concentration of the reactant, R. Which one of the following graphs is not correct for this reaction? (slope = slope of the line) (A) Graph of ln[R] (y-axis) vs time (x-axis): a straight line falling from ln[R]0, with k=−Slope (B) Graph of [R] (y-axis) vs time (x-axis): a straight line falling from [R]0, with k=−Slope (C) Graph of log[R] (y-axis) vs time (x-axis): a straight line falling from log[R]0, with k=−Slope×2.303 (D) Graph of log[R][R]0 (y-axis) vs time (x-axis): a straight line rising from the origin, with Slope=2.303k
›Reveal solutionSolution
A half-life independent of initial concentration identifies a first-order reaction, for which [R] falls exponentially with time. So the plot showing [R] itself as a straight line is the incorrect one — option (B).
The concept first
Start from the rate law and integrate.
First order: −dtd[R]=k[R] gives
ln[R][R]0=kt⟺ln[R]=ln[R]0−kt,
and hence the half-life
t1/2=kln2=k0.693,
which contains no [R]0 — exactly the property stated in the question. (For a zero-order reaction t1/2=[R]0/2k, and for second order t1/2=1/k[R]0; both do depend on [R]0.) So the reaction is first order.
The important structural consequence: in first-order kinetics it is the logarithm of the concentration that falls linearly, not the concentration itself.
Step 1 — Check graph (A): ln[R] vs t
ln[R]=ln[R]0−kt
Straight line, intercept ln[R]0, slope −k, so k=−slope. Correct.
Step 2 — Check graph (C): log[R] vs t
Divide the same equation by 2.303:
log[R]=log[R]0−2.303kt
Slope =−2.303k, so k=−slope×2.303. Correct. …
- TG EAPCET 2025Set eng-2025-05-04-FN1 markMCQQ.A metal (M), crystallizes in fcc lattice with edge length of 4.242 Å. What is the radius of M atom (in Å)? (A) 1.5 (B) 1.0 (C) 1.75 (D) 1.25
›Reveal solutionSolution
In a face-centered cubic (fcc) lattice, atoms touch along the face diagonal, leading to the relationship 4r=2a, where r is the atomic radius and a is the edge length. For an edge length of 4.242 Å, the radius of the M atom is 1.5 Å.
Concept and Intuition
When a metal crystallizes in a face-centered cubic (fcc) lattice, it means the atoms are located at all eight corners of the cube and at the center of each of the six faces. To understand the relationship between the edge length (a) of the unit cell and the radius (r) of the atom, we need to identify where the atoms are in direct contact.
In an fcc structure, the atoms at the corners do not touch each other along the edge of the cube. Instead, the atoms touch along the face diagonal. Imagine one face of the cube: there are atoms at the two opposite corners of that face, and a third atom exactly in the center of that face. These three atoms are in contact along the face diagonal.
Consider a face of the cube with edge length a. The length of the face diagonal can be found using the Pythagorean theorem. If we consider a right-angled triangle formed by two edges and the face diagonal, the diagonal is the hypotenuse.
Let the edge length be a.
The face diagonal, d, is given by:
d2=a2+a2
d2=2a2
d=2a
Along this face diagonal, we have a corner atom (radius r), followed by the face-centered atom (diameter 2r), and then another corner atom (radius r). Therefore, the total length of the face diagonal is r+2r+r=4r.
Equating these two expressions for the face diagonal:
4r=2a
This is the fundamental relationship for an fcc lattice that allows us to calculate the atomic radius if the edge length is known, or vice versa.
For a face-centered cubic (fcc) lattice, the relationship between the atomic radius (r) and the edge length (a) is:
4r=2a
This can be rearranged to find the radius:
r=42a=22a
Step-by-step Solution
-
Identify the given information:
We are given that the metal M crystallizes in an fcc lattice and its edge length (a) is 4.242 Å.
-
Recall the relationship between edge length and atomic radius for an fcc lattice:
As derived above, for an fcc lattice, the atoms touch along the face diagonal. The length of the face diagonal is 2a, and it is also equal to 4r (where r is the atomic radius).
So, we have the formula: …
-
- TG EAPCET 2025Set ap-2025-04-29-AN1 markMCQQ.The slope of isobar of one mole of an ideal gas at p (atm) is 0.082 LK−1. What is the value of p in atm?\ (R = 0.082 Latmmol−1K−1) (A) 0.082 (B) 10 (C) 1 (D) 0.1
›Reveal solutionSolution
The slope of an isobar (constant pressure) on a V–T graph for one mole of an ideal gas is pR. Equating this to the given slope 0.082 LK−1 and using R=0.082 Latmmol−1K−1 gives p=1 atm.
The key here is to connect the physical meaning of an isobar to the ideal gas law. An isobar is a line of constant pressure on a graph — typically volume V against temperature T. For one mole of an ideal gas, the equation of state is pV=RT. When p is fixed, V and T are directly proportional: V=(pR)T. This is a straight line through the origin, and its slope is pR.
The problem gives you that slope numerically: 0.082 LK−1. You also know R=0.082 Latmmol−1K−1. So you can set up a simple equation.
-
Write the ideal gas law for one mole: pV=RT.
At constant p, rearrange to V=pRT.
This is of the form V=(slope)×T, so the slope of the isobar on a V–T graph is pR.
-
The given slope is 0.082 LK−1. Therefore:
pR=0.082 LK−1
- Substitute R=0.082 Latmmol−1K−1:
p0.082=0.082
- Solve for p: Multiply both sides by p: 0.082=0.082p …
-
- TG EAPCET 2025Set ap-2025-04-29-FN1 markMCQQ.For a first order reaction (A→P), the following graph is obtained. The slopes at points A, B and C are mA, mB and mC respectively. What is the correct order of slopes? (A) mA=mB=mC (B) mA>mB>mC (C) mC>mB>mA (D) mB>mC>mA
![A single graph (no axes numbers). The vertical axis is labelled [A] (an upward arrow bes](/figures/tg-eapcet/ap-2025-04-29-FN-chemistry-q144.svg)
›Reveal solutionSolution
For a first-order reaction, the rate (and hence the slope of a concentration vs. time plot) is proportional to the instantaneous concentration. As concentration decreases from A to B to C, the slope becomes less negative. The correct order is mA>mB>mC.
The graph shows concentration of reactant A versus time for a first-order reaction. The slope at any point on this curve represents the rate of change of concentration with time, which is precisely the reaction rate (with a negative sign, since concentration decreases).
For a first-order reaction, the rate law is:
−dtd[A]=k[A]
This tells us that the rate at any instant is directly proportional to the concentration at that instant. Higher concentration means faster reaction, which means a steeper (more negative) slope on the concentration-time graph.
Now let's trace what happens as we move from point A to B to C along the curve:
-
At point A (earliest time): The concentration is highest. The reaction proceeds most rapidly here, so dtd[A] is most negative. The slope mA has the largest magnitude in the negative direction.
-
At point B (intermediate time): Concentration has decreased compared to A. The reaction rate has slowed down, so dtd[A] is less negative than at A. The slope mB has a smaller magnitude.
-
At point C (latest time): Concentration is lowest among the three points. The reaction is slowest here, so dtd[A] is least negative. The slope mC has the smallest magnitude. …
-
- TG EAPCET 2025Set ap-2025-04-30-FN1 markMCQQ.The isobar of one mole of an ideal gas was obtained at P atm. The slope of the isobar is 0.82L K−1. What is P (in atm)? (A) 10 (B) 1 (C) 0.1 (D) 0.01
›Reveal solutionSolution
The slope of an isobar on a V–T graph for one mole of an ideal gas is PnR. Equating this to 0.82 L K−1 and using R=0.0821 L atm mol−1K−1 gives P=0.1 atm.
The key is to recognise what an isobar means physically: a process at constant pressure. For an ideal gas, the relation between volume and temperature at fixed pressure is given by the ideal gas law. The slope of the V–T graph at constant P is not just any number — it is directly linked to nR/P.
Let’s unpack that.
- Start with the ideal gas law For one mole of an ideal gas:
PV=nRT⇒PV=RT(since n=1)
At constant pressure P, this becomes a linear relation between V and T:
V=PRT
So V is directly proportional to T, and the graph of V vs T is a straight line through the origin.
- Identify the slope The slope of this line is the coefficient of T:
slope=PR
The problem gives this slope as 0.82 L K−1.
- Use the correct value of R Since the slope is in L K−1 and pressure is in atm, we must use R in compatible units:
R=0.0821 L atm mol−1K−1
This is a standard value you must remember for such problems.
- Set up and solve PR=0.82⇒P=0.82R …
- TG EAPCET 2025Set ap-2025-04-30-FN1 markMCQQ.For a first order reaction (R → P), a plot of ln([R][R]0) on y-axis and time on x-axis gave a straight line passing through the origin. The slope of straight line is ‘x’. The rate constant of this reaction is (A) 2.303x (B) x−1 (C) x (D) 2.303x
›Reveal solutionSolution
For a first-order reaction, the integrated rate law gives ln[R][R]0=kt, so a plot of ln[R][R]0 vs. time is a straight line through the origin with slope k. Hence the slope x equals the rate constant k, and the answer is (C).
The key here is to recall the integrated rate law for a first-order reaction. For a reaction R→P, the rate depends on the concentration of R as:
−dtd[R]=k[R]
Integrating this from initial concentration [R]0 at t=0 to [R] at time t gives:
ln[R][R]0=kt
This is the straight-line form: if you plot ln[R][R]0 on the y-axis and time t on the x-axis, you get a line with slope k and intercept 0 (passing through the origin). No conversion factor like 2.303 appears because we are using natural logarithms, not base-10 logs. …
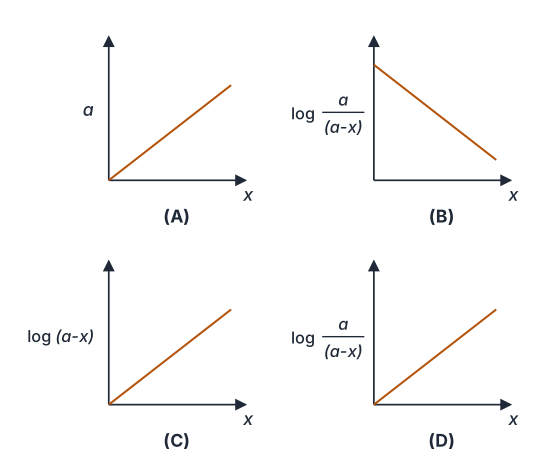
- TG EAPCET 2024Set ap-2024-05-08-FN1 markMCQQ.Identify the correct graph for a first order reaction (A→P) (x-axis = time; a = initial concentration of A; (a−x) = concentration of A at time t) (A) [FIGURE] A plot of a (y-axis) versus x (time) giving a straight line with positive slope (B) [FIGURE] A plot of log(a−x)a (y-axis) versus x (time) giving a straight line with negative slope (C) [FIGURE] A plot of log(a−x) (y-axis) versus x (time) giving a straight line with positive slope (D) [FIGURE] A plot of log(a−x)a (y-axis) versus x (time) giving a straight line with positive slope passing through the origin
›Reveal solutionSolution
Integrating the first-order rate law gives loga−xa=2.303kt — a straight line through the origin with positive slope. That is exactly the graph in option (D).
The concept first: deriving the first-order integrated rate law
Let the initial concentration of A be a and let x be the amount that has reacted after time t, so the concentration remaining is (a−x).
Step 1 — write the differential rate law. For a first-order reaction the rate is proportional to the first power of the reactant concentration:
rate=dtdx=k(a−x)
Step 2 — separate the variables.
a−xdx=kdt
Step 3 — integrate between the limits x=0 at t=0 and x=x at t=t.
∫0xa−xdx=k∫0tdt⟹−ln(a−x)0x=kt
lna−xa=kt⟹k=t2.303loga−xa
Step 4 — put it into straight-line form y=mx+c.
loga−xa=slope m2.303kt+intercept0
Read off the three things a graph question always wants:
- y-variable: loga−xa
- slope: +2.303k — positive (since k>0)
- intercept: zero — the line passes through the origin. This is physically obvious: at t=0 nothing has reacted, x=0, so logaa=log1=0.
Step 5 — test the printed options
- (A) plots a (a constant, the initial concentration) against t. A constant cannot rise with a positive slope; meaningless. ✗ …
- TG EAPCET 2024Set eng-2024-05-09-FN1 markMCQQ.Which one of the following corresponds to the wavelength of line spectrum of H atom in its Balmer series? (R = Rydberg constant) (A) 8R9 (B) 21R100 (C) 24R25 (D) 15R16
›Reveal solutionSolution
The Balmer series corresponds to transitions ending at n=2; the wavelength is given by λ1=R(221−n21). Evaluating the four options shows that only 21R100 matches a valid Balmer transition (n=5→2), so the correct option is (B).
The Balmer series of the hydrogen atom consists of spectral lines produced when an electron falls from a higher energy level (n≥3) to the second energy level (n=2). The Rydberg formula for the wavelength λ of such a transition is:
λ1=R(221−n21),n=3,4,5,…
where R is the Rydberg constant. Our task is to see which of the given expressions for λ (in terms of R) can be written in the form λ1=R⋅(some rational number) that matches a valid n.
- Rewrite each option as 1/λ For an option λ=bRa, we have
λ1=abR.
This must equal R(41−n21) for some integer n≥3.
- Test option (A): λ=8R9
λ1=98R=R⋅98.
Set 41−n21=98. Then n21=41−98=369−32=−3623, which is negative — impossible. So (A) is invalid.
- Test option (B): λ=21R100
λ1=10021R=R⋅10021.
Solve 41−n21=10021.
n21=41−10021=10025−10021=1004=251.
Hence n2=25 and n=5. Since n=5 is a valid upper level (n≥3), this works. So (B) corresponds to the 5→2 transition.
- Test option (C): λ=24R25
λ1=2524R=R⋅2524.
Then 41−n21=2524 gives n21=41−2524=10025−96=−10071 — negative. Invalid. …
- TG EAPCET 2024Set eng-2024-05-09-FN1 markMCQQ.Adsorption of a gas (A) on an adsorbent follows Freundlich adsorption isotherm. The slope and intercept (on y-axis) of the isotherm are 0.5 and 1.0 respectively. What is the value of mx when the pressure of the gas (A) is 100 atm? (A) 10 (B) 1 (C) 100 (D) 1000
›Reveal solutionSolution
The Freundlich isotherm is log(x/m)=logk+(1/n)logP; given slope 1/n=0.5 and intercept logk=1.0, at P=100 we get log(x/m)=1.0+0.5×2=2.0, so x/m=100. The correct option is (C).
Concept & Intuition
The Freundlich adsorption isotherm describes how the amount of gas adsorbed per unit mass of adsorbent (x/m) varies with pressure P. It is an empirical relation:
mx=kP1/n
where k and n are constants. Taking logarithms gives a straight line:
log(mx)=logk+n1logP
Here, the slope is 1/n and the intercept (on the log(x/m) axis) is logk. The problem gives slope = 0.5 and intercept = 1.0 — but careful: these are the slope and intercept of the log–log plot, not of the original curve. So we directly plug into the linear form.
Step-by-step
- Write the linear form of the Freundlich isotherm
log(mx)=logk+n1logP
The slope is 1/n=0.5, and the intercept (y-intercept) is logk=1.0.
- Substitute the given pressure Pressure P=100 atm. Compute logP (using base 10, as is standard for such plots):
log10(100)=2
- Calculate log(x/m)
log(mx)=1.0+0.5×2=1.0+1.0=2.0
- Find x/m …
- TG EAPCET 2024Set eng-2024-05-10-AN1 markMCQQ.For a first order reaction, the graph between log(a−x)a (on y-axis) and time (in min, on x-axis) gave a straight line passing through origin. The slope is 2×10⁻³ min−1. What is the rate constant (in min−1)? (A) 2×10⁻³ (B) 2.3032×10⁻³ (C) 4.606×10⁻³ (D) 0.5×10⁻⁵
›Reveal solutionSolution
For a first‑order reaction, the integrated rate law gives loga−xa=2.303kt, so the slope of the loga−xa vs. t plot is k/2.303. With slope 2×10⁻³ min−1, the rate constant is k=2.303×2×10−3=4.606×10⁻³ min−1, which corresponds to option (C).
Concept & Intuition
For a first‑order reaction A→products, the concentration of reactant at time t is given by
lna−xa=kt
where a is the initial concentration and x is the amount reacted.
If we convert natural log to base‑10 log, we get
loga−xa=2.303kt.
This is a straight line through the origin when loga−xa is plotted against t. The slope of that line is not k itself, but k/2.303. Many students mistakenly take the slope directly as the rate constant — that’s the classic pitfall here.
Step‑by‑step reasoning
- Write the first‑order integrated rate law in base‑10 form
loga−xa=2.303kt
This is of the form y=mt, where y=loga−xa and m is the slope.
- Identify the given slope The problem states the slope of the straight line is 2×10⁻³ min−1. So
slope=2.303k=2×10⁻³
- Solve for the rate constant k …
🎓Unlock everything free for 14 days
- ✓Full step-by-step solutions
- ✓Concept-first explanations
- ✓Methods, shortcuts & mistakes
- ✓PYQ mapping + timed mock tests
Full access for 14 days. No credit card required.