Physics · Ch 1 — Waves
Beats
Beats
The Phenomenon of Beats
When two sound waves of nearly the same frequency travel through the same medium and are heard together, something remarkable happens. You do not hear two separate tones. Instead, you hear a single tone whose pitch is the average of the two frequencies, but whose loudness rises and falls in a regular, rhythmic pattern. This periodic waxing and waning of sound intensity is called beats.
The effect is not limited to sound — it occurs for any kind of wave (light waves, water waves, etc.) whenever two waves of slightly different frequencies are superposed. But it is most familiar to us in acoustics, and musicians use it deliberately to tune their instruments. When two strings are almost in tune, the beat frequency tells them exactly how far apart the frequencies are; they adjust until the beats disappear, meaning the frequencies are equal.
The word "beat" here refers to the periodic pulse you hear — one beat per cycle of loudness variation. It has nothing to do with the musical rhythm or "taal" in Indian classical music, though the word is the same.
The Mathematical Description
Consider two harmonic waves of equal amplitude , travelling through the same medium, with angular frequencies and that are nearly equal. Let their displacements at a point and time be:
By the principle of superposition, the resultant displacement is:
Now use the trigonometric identity:
Let and . Then:
Since the two frequencies are very close, and . Define:
Then the resultant wave can be written as:
This is the key result. The resultant wave behaves like a wave of frequency (the average of the two original frequencies), but its amplitude is not constant — it is modulated by the factor .
The Beat Frequency
The amplitude envelope varies with time as . The intensity (loudness) is proportional to the square of the amplitude, so it varies as .
The cosine function goes through one complete cycle when its argument changes by . So the time between successive maxima of loudness (or successive minima) is given by:
Since , where is the ordinary frequency in hertz, we have . Therefore:
The beat frequency is the number of loudness maxima per second, which is the reciprocal of the beat period:
Since frequency is always taken as positive, we write:
This is the central result: the beat frequency equals the absolute difference of the two original frequencies.
A common mistake is to think the beat frequency is or . The amplitude envelope oscillates at half the difference frequency, but the intensity (which is what we hear) oscillates at the full difference frequency. Each maximum of the cosine envelope gives one beat, and there are such maxima per second.
A Concrete Example
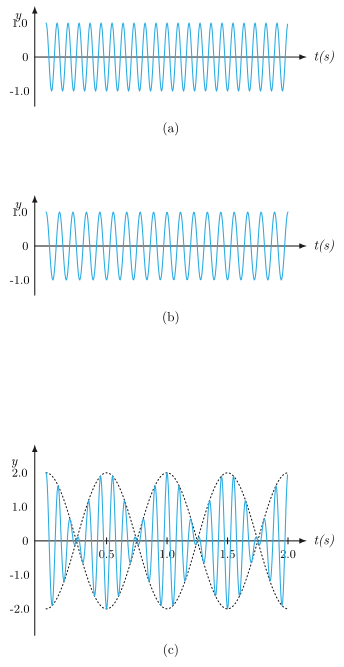
Figure 14.16 in the textbook illustrates this with two waves of frequencies 11 Hz and 9 Hz. The resultant wave shows a clear pattern: the amplitude swells and fades at a rate of 2 Hz — exactly the difference between 11 Hz and 9 Hz. If you were to listen to these two tones together, you would hear a note of pitch roughly 10 Hz (the average), but with a distinct throbbing or pulsing that repeats twice every second.
Solved Example: Tuning Sitar Strings
Example 14.6 Two sitar strings A and B playing the note 'Dha' are slightly out of tune and produce beats of frequency 5 Hz. The tension of string B is slightly increased and the beat frequency is found to decrease to 3 Hz. What is the original frequency of B if the frequency of A is 427 Hz?
Solution. Increasing the tension of a string increases its frequency (since and the fundamental frequency ). So when we increase tension in B, increases.
Now, the beat frequency is . Initially it is 5 Hz. After increasing , the beat frequency drops to 3 Hz. This tells us something crucial about which frequency is larger.
If were originally greater than , then increasing further would make the difference even larger — the beat frequency would increase. But it decreases. Therefore, must originally have been less than .
So Hz. Given Hz, we get:
After increasing tension, rises. The new beat frequency is 3 Hz. Since is still less than (otherwise the beat frequency would have increased through zero and then grown again), we have Hz, so Hz. The tension increase raised B's frequency by 2 Hz. …
Drawn by us to help you understand the concept clearly, and verified to make sure it's accurate. For exams, practice from your textbook's own diagram.
Figure 14.16 is a three-panel plot of displacement against time . The top panel, labelled (a), shows a pure sine wave oscillating at 11 Hz — that is, 11 complete cycles in one second. The middle panel, (b), shows another pure sine wave at 9 Hz. Both are drawn with the same amplitude and start in phase at . The bottom panel, (c), shows the sum of these two waves. The result is no longer a simple sinusoid: a rapid oscillation (the carrier) rides inside a slow, smooth envelope that swells and fades. The dashed curve in panel (c) outlines this envelope, and the time axis is marked at 0.5 s and 1.0 s so you can measure the period of the envelope.
The physical idea is beats. When two sound waves of nearly equal frequency travel together, the loudness at a fixed point rises and falls periodically. The ear hears a tone at the average frequency, whose intensity pulses at the beat frequency — the difference of the two original frequencies. In the figure, the 11 Hz and 9 Hz waves produce a beat frequency of Hz. You can verify this from the envelope: one full cycle of the envelope (from maximum to maximum) takes 0.5 s, which corresponds to a frequency of Hz.
The mathematics is straightforward. Write the two waves as
Their superposition, using the sum-to-product identity, gives
Here Hz is the frequency of the fast carrier (the sine factor), and Hz is the frequency of the envelope (the cosine factor). The amplitude of the carrier is modulated by the cosine term, so the intensity varies at twice the envelope frequency — but the ear detects the envelope itself, giving the perceived beat frequency . …
Drawn by us to help you understand the concept clearly, and verified to make sure it's accurate. For exams, practice from your textbook's own diagram.
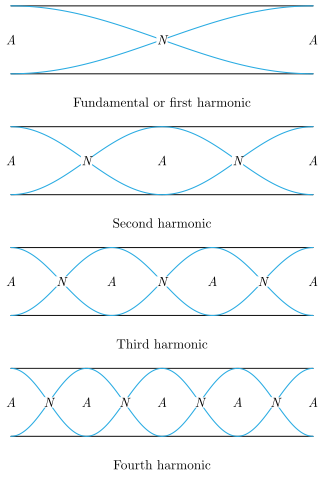
The figure shows four horizontal patterns stacked vertically, one above the other, each representing a standing wave inside a pipe that is open at both ends. The pipe itself is not drawn; instead, each pattern is a horizontal line with a series of curves (like sine waves) drawn above and below it. The left and right ends of each pattern correspond to the two open ends of the pipe. At both ends, the curve meets the horizontal line — this is the visual cue for an antinode (maximum displacement). Between the ends, the curve crosses the horizontal line at nodes (points of zero displacement) and reaches peaks or troughs at antinodes.
The four patterns are labelled, from top to bottom, as the fundamental (or first harmonic), the second harmonic, the third harmonic, and the fourth harmonic. In the fundamental pattern, there is a single antinode at each end and one node in the exact middle — the pipe length contains exactly half a wavelength. In the second harmonic, you see an antinode at each end, a node at the centre, and an antinode halfway between the centre and each end — that is, one full wavelength fits into the pipe. The third harmonic shows three antinodes (ends plus two interior ones) and three nodes; the fourth shows four antinodes and four nodes. In every pattern, the ends are always antinodes because the air at an open end is free to move.
The physical idea is that only certain standing-wave patterns can persist in an open pipe: those for which the pipe length is an integer multiple of half a wavelength. Since both ends are antinodes, the distance between successive antinodes is , so for . This gives the allowed wavelengths:
Here is the length of the pipe, is the harmonic number (1 for fundamental, 2 for second harmonic, etc.), and is the wavelength of the th harmonic. The corresponding frequencies follow from , where is the speed of sound in air:
So the fundamental frequency is , and all higher harmonics are integer multiples of this: . This is the key result: an open pipe supports all harmonics — the full set of integer multiples of the fundamental. The figure makes this visible: each successive pattern has one more node and one more antinode, and the wavelength shrinks by a factor . …