Physics · Ch 10 — Thermal Properties of Matter
Newton's Law of Cooling
Newton's Law of Cooling
Newton's Law of Cooling
The Phenomenon of Cooling
Every hot object left to itself eventually reaches the temperature of its surroundings. A cup of tea on a table, a hot pan taken off the stove, or a heated metal block in a room — all cool down over time. The question Newton asked was: how fast does this cooling happen, and what does the rate depend on?
The answer is not uniform. If you watch a hot object cool, you notice that it loses heat quickly at first, when it is much hotter than the room, and then more slowly as it approaches room temperature. The rate of cooling is not constant — it depends on how hot the object is relative to its surroundings.
The Experimental Observation
Take a calorimeter with 300 mL of water, fitted with a stirrer and a thermometer. Note the room temperature . Heat the water until it is about 40 °C above room temperature, then remove the heat source. Stir gently and record the temperature every minute. Continue until the water is only about 5 °C above room temperature.
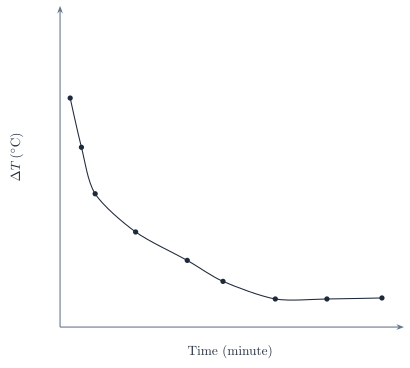
Plot a graph with (the temperature difference between the water and the surroundings) on the y-axis and time on the x-axis. The curve you get looks like Fig. 10.19 — it falls steeply at first and then flattens out. This tells you that the rate of cooling is highest when the temperature difference is largest, and it decreases as the object cools.
Statement of Newton's Law of Cooling
Newton's law of cooling states that the rate of loss of heat by a body is directly proportional to the excess temperature of the body over its surroundings.
Mathematically, if is the temperature of the body and is the temperature of the surroundings (assumed constant), then
or
where is a positive constant that depends on the area and nature of the surface of the body. The negative sign indicates that heat is being lost — itself is negative, so is positive.
Newton's law of cooling holds accurately only for small temperature differences between the body and its surroundings. For large differences, the cooling rate deviates from this simple linear relation because radiation losses follow the law (Stefan-Boltzmann law), not a linear one.
The constant is not universal — it depends on:
- the surface area of the body (larger area → faster cooling)
- the nature of the surface (rough, dark surfaces radiate more efficiently than smooth, polished ones)
- the conditions of the surrounding medium (air currents, humidity, etc.)
Deriving the Temperature-Time Relation
Suppose a body of mass and specific heat capacity is at temperature , and the surroundings are at constant temperature . If the temperature falls by a small amount in time , the heat lost is
The rate of loss of heat is therefore
Now apply Newton's law:
Substituting the expression for :
Rearrange to separate the variables:
Define a new constant , which has units of (time). Then
›Proof
Integrating the differential equation
Integrate both sides. The left side is integrated from the initial temperature at time to the temperature at time :
The left integral gives evaluated between the limits:
Exponentiate both sides:
Or equivalently,
The general solution can also be written as
where is the constant of integration. Or
where is determined by the initial condition.
The temperature difference decays exponentially with time. This means that the excess temperature falls by the same fraction in equal intervals of time, not by the same amount.
Verification of the Law
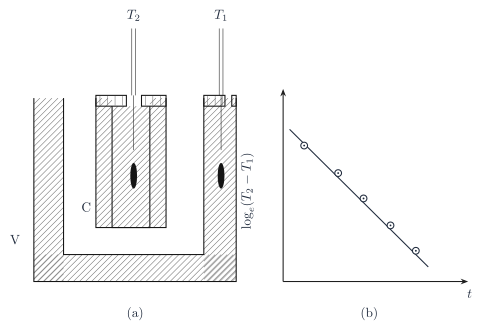
The experimental setup for verification is shown in Fig. 10.20(a). It consists of a double-walled vessel with water between the walls (this water acts as the surroundings at constant temperature ). A copper calorimeter containing hot water is placed inside this vessel. Two thermometers measure (water in the calorimeter) and (water between the walls).
Record at regular time intervals. Then plot against time .
According to the derived equation , this graph should be a straight line with a negative slope of magnitude . Fig. 10.20(b) shows exactly this — a straight line, confirming Newton's law of cooling.
The slope of the vs. graph gives you the value of directly. From , you can find the cooling constant if you know the mass and specific heat capacity of the body.
Worked Example
Example 10.8: A pan filled with hot food cools from 94 °C to 86 °C in 2 minutes when the room temperature is 20 °C. How long will it take to cool from 71 °C to 69 °C?
Solution:
For the first cooling interval (94 °C to 86 °C):
- Average temperature = °C
- Excess above room temperature = °C
- Temperature drop = °C
- Time taken = 2 minutes
Using the rate equation :
For the second cooling interval (71 °C to 69 °C):
- Average temperature = °C
- Excess above room temperature = °C
- Temperature drop = °C
- Let the time taken be minutes …
Drawn by us to help you understand the concept clearly, and verified to make sure it's accurate. For exams, practice from your textbook's own diagram.
The figure plots the temperature difference (in °C) between a hot body and its surroundings against time (in minutes). The vertical axis is labelled , the horizontal axis is . The curve starts at a high value at and falls steeply at first, then gradually flattens out as it approaches the horizontal axis. The data points are plotted as discrete dots, and a smooth curve is drawn through them. There is no second curve or panel — just this single exponential-decay shape.
The physical idea is Newton’s law of cooling: the rate at which a hot object loses heat is proportional to the temperature difference between the object and its surroundings. When the object is much hotter than the room, it cools quickly; as it approaches room temperature, the cooling slows down. The curve’s steep initial slope and later gentle slope directly show this decreasing rate. The curve never quite reaches on the graph — it asymptotically approaches it, because in theory the object takes infinite time to reach exact thermal equilibrium.
The textbook uses this figure to derive and verify the exponential decay law. If the rate of cooling is and the heat lost is (where is mass and is specific heat capacity), Newton’s law gives:
Here is the object’s temperature at time , is the constant surrounding temperature, and is a positive constant that depends on the object’s surface area, emissivity, and heat capacity. The minus sign indicates cooling. Let . Then:
This is a first-order differential equation. Its solution is:
where is the initial temperature difference. The figure’s curve is exactly this exponential decay: starts at and falls off with time constant . …
Drawn by us to help you understand the concept clearly, and verified to make sure it's accurate. For exams, practice from your textbook's own diagram.
Figure 10.20 in the NCERT textbook is a two-part illustration that shows both the experimental setup and the graphical method used to verify Newton’s law of cooling. The figure is split into two panels, labelled (a) and (b).
Panel (a) shows the apparatus. A double-walled vessel V is filled with water, which acts as a constant-temperature surroundings. Inside this vessel sits an inner copper calorimeter C containing hot water. Two thermometers, T₁ and T₂, are inserted through corks: T₂ measures the temperature of the hot water inside the calorimeter, and T₁ measures the temperature of the water in the outer vessel (the surroundings). The key idea is that the outer water bath stays at a nearly fixed temperature, so the temperature difference between the hot water and its surroundings drives the cooling.
Panel (b) is a graph with time on the horizontal axis and on the vertical axis. The plot shows a straight line with a negative slope. This is the crucial verification: if Newton’s law of cooling holds, the rate of cooling is proportional to the temperature difference, and the solution to that differential equation gives an exponential decay of the temperature difference. Taking the natural logarithm of that difference turns the exponential curve into a straight line.
The physical idea the figure teaches is that Newton’s law of cooling is not just a statement about instantaneous rates — it predicts a specific mathematical form for how the temperature difference changes over time. The straight line on the semi-log plot is direct experimental evidence that the law is correct under the conditions of the experiment.
The textbook develops the following central formula from this figure. Newton’s law of cooling states:
where is the temperature of the hot water in the calorimeter, is the temperature of the surroundings (the outer water bath), is time, and is a positive constant that depends on the surface area and nature of the calorimeter. The negative sign indicates that the temperature difference decreases with time.
Integrating this differential equation gives:
where is the initial temperature difference at . Taking natural logarithms on both sides yields:
This is the equation of a straight line with slope and intercept . The straight line in panel (b) confirms this relationship experimentally. …