Q.Explain the marginal cost with the help of table and diagram?
🔒You're viewing a preview — the full solution, concept, methods & PYQ mapping are locked.
🔒 Start your 14-day free trial to unlock the full solution →Concept understanding — Cost Concepts
Cost Concepts: From Everyday Intuition to Economic Precision
Think about the last time you bought something — say, a plate of chole bhature from a roadside stall. The stall owner paid for flour, oil, spices, gas, and the helper's wages. That's the obvious cost. But what about the rent of the cart? The interest on the loan he took to buy the stove? And what about the fact that he could have worked as a driver instead — the income he gave up? That last one is a cost too, though no money changed hands.
That's where economics begins to separate itself from simple accounting. Costs are not just what you pay; they are what you sacrifice.
The Core Idea: Opportunity Cost
The single most important cost concept in economics is opportunity cost. The NCERT Class-12 textbook defines it clearly: opportunity cost is the cost of the next best alternative foregone.
Opportunity cost = value of the next best alternative that you give up when you make a choice.
Why does this matter? Because resources — time, money, land, labour — are scarce. Every choice has a hidden cost: the thing you didn't choose. When the stall owner chooses to run his stall, he gives up the salary he could have earned as a driver. That foregone salary is a real cost, even if it never appears in his cash register.
Explicit vs Implicit Costs
From opportunity cost, we get two categories:
- Explicit costs — actual money payments made to others (wages, rent, raw materials, electricity bills). These are recorded in the books.
- Implicit costs — the value of self-owned resources used in production, for which no explicit payment is made. The owner's own labour, his own capital, his own land — these have opportunity costs that are not paid to anyone else.
In accounting, only explicit costs are counted. In economics, both explicit and implicit costs matter, because economics is about the full sacrifice.
Total, Average, and Marginal Costs
Once we move to production, costs are studied in relation to output. The NCERT textbook introduces these three measures:
Total Cost (TC)
The sum of all costs — explicit and implicit — incurred to produce a given level of output.
Average Cost (AC)
Cost per unit of output.
AC=QTC
where Q is the quantity of output.
Marginal Cost (MC)
The additional cost incurred to produce one more unit of output.
MC=ΔQΔTC
where Δ means "change in".
MC is the cost of the last unit produced. AC is the cost of all units averaged. They behave differently as output changes.
Short-Run vs Long-Run Costs
This distinction is crucial. In the short run, at least one factor of production is fixed (typically capital — factory size, machinery). In the long run, all factors are variable.
Short-Run Cost Categories
| Cost | Symbol | Definition |
|---|---|---|
| Total Fixed Cost | TFC | Cost that does not change with output (rent, insurance, interest on loans) |
| Total Variable Cost | TVC | Cost that changes with output (raw materials, wages of daily workers, electricity) |
| Total Cost | TC | TC=TFC+TVC |
From these, we derive:
- Average Fixed Cost (AFC) = QTFC — falls continuously as output rises.
- Average Variable Cost (AVC) = QTVC — typically U-shaped.
- Average Cost (AC) = QTC=AFC+AVC
A common mistake: thinking that AC and AVC are the same. They are not. AC includes AFC, so AC always lies above AVC. The gap between them is AFC, which shrinks as output increases.
The Shape of the Curves
Imagine a graph with output on the horizontal axis and cost on the vertical axis.
- TFC is a horizontal straight line — it never changes. …
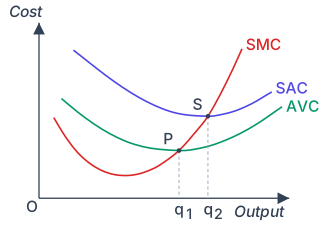
Marginal cost is the extra cost of producing one more unit of output, calculated directly from a cost schedule as the change in total cost between consecutive output levels.
…
MC = ΔTC/ΔQ; the MC curve is U-shaped, falling then rising as output expands.
Illustrative schedule (Total Fixed Cost = ₹10):
Output: 0, 1, 2, 3, 4
Total Cost (₹): 10, 17, 22, 29, 39
Marginal Cost (₹): —, 7, 5, 7, 10
MC for the 1st unit = 17 − 10 = ₹7; for the 2nd unit = 22 − 17 = ₹5; for the 3rd unit = 29 − 22 = ₹7; for the 4th unit = 39 − 29 = ₹10. MC falls initially because the firm is using its fixed plant more efficiently as the variable input (labour) is added (increasing returns to the variable factor), reaches a minimum, and then rises because of diminishing returns as the fixed plant becomes overcrowded. On a diagram with output on the X-axis and cost on the Y-axis, the MC curve therefore traces a U-shape — sloping down, touching a minimum, then sloping up steeply.
…
Showing the 12 most recent of 47 on this concept.
- CBSE 2026Set MARCH1 markMCQQ.Change in total cost for an additional unit change in output is(a) Average Fixed Cost(b) Average Variable Cost(c) Marginal Cost(d) Average Cost
›Reveal solutionSolution
Marginal cost is the addition to total cost from producing one more unit of output, so the answer is (c).
…
- CBSE 2026Set MARCH1 markMCQQ.Find the Total Cost, where TFC is Rs. 200 and TVC is Rs. 225.(a) a) 125(b) b) 225(c) c) 425(d) d) 25
›Reveal solutionSolution
TC = TFC + TVC = 200 + 225 = Rs. 425, so the correct option is (c) 425.
In cost analysis, Total Cost (TC) is always the sum of Total Fixed Cost (TFC), which does not change with output, and Total Variable Cost (TVC), which changes with output.
Given TFC = Rs. 200 and TVC = Rs. 225:
TC = TFC + TVC = 200 + 225 = Rs. 425.
…
- CBSE 2026Set ANNUAL1 markMCQQ.Which of the following is the shape of total fix cost curve? [FIGURE: four option graphs on X–Y axes — A) a horizontal straight line parallel to the X-axis; B) a vertical straight line parallel to the Y-axis; C) a downward-sloping curve falling left to right; D) an upward-rising curve sloping up to the right] A) [graph A] B) [graph B] C) [graph C] D) [graph D]
›Reveal solutionSolution
The total fixed cost curve is a horizontal line parallel to the output (X) axis, so the answer is A.
Total Fixed Cost (TFC) is the cost of fixed factors and does not change with the level of output — the firm pays the same amount whether it produces one unit or many. When plotted with output on the X-axis and cost on the Y-axis, a constant value traces a horizontal straight line parallel to the X-axis. (The options shown as [FIGURE] describe: A) a horizontal line, B) a vertical line, C) a downwa …
- CBSE 2026Set ANNUAL1 markQ.Fill in the blank: Longrun average cost curve is a ________ shaped curve.
›Reveal solutionSolution
The blank is filled by 'U' (U-shaped).
In the long run all factors are variable. As output expands, the firm first enjoys economies of scale, so long-run average cost (LAC) falls; beyond the optimum scale, diseconomies of scale set in and LAC rises. This fall-then-rise behaviour gives the long-run average cost curve its characterist …
- CBSE 2026Set ANNUAL1 markMCQQ.Write True or False: The average fixed cost curve is a rectangular hyperbola.(a) True(b) False
›Reveal solutionSolution
True — the AFC curve is a rectangular hyperbola.
Average fixed cost (AFC) = Total Fixed Cost ÷ Output. Since total fixed cost is constant, AFC falls continuously as output increases, but it never touches the X-axis (it approaches zero). Because the product of AFC and output (= TFC) is always constant, the AFC cu …
- CBSE 2025Set MARCH1 markMCQQ.Find Total Cost, when TFC is 100 and TVC is 125.(a) a) 25(b) b) 125(c) c) 175(d) d) 225
›Reveal solutionSolution
TC = TFC + TVC = 100 + 125 = 225, so option (d).
In the theory of costs, Total Cost (TC) of a firm at any output is the sum of its Total Fixed Cost (TFC), which does not vary with output, and its Total Variable Cost (TVC), which varies with output …
- CBSE 2025Set ANNUAL1 markMCQQ.With the increase in production the difference between total and total fixed cost (A) remains constant (B) increases (C) decreases (D) both increases and decreases
›Reveal solutionSolution
The difference between total cost and total fixed cost is total variable cost, which rises as output rises; the answer is (B).
Total Cost (TC) is made up of Total Fixed Cost (TFC) and Total Variable Cost (TVC): TC = TFC + TVC. Therefore the difference between total cost and total fixed cost is exactly the total variable cost: TC - TFC = TVC. Fixed cost stays the same at all output levels, but variable cost increases as more output is produced (more raw material, labour and …
- CBSE 2025Set ANNUAL1 markMCQQ.The alternative name of opportunity cost is (A) Economic cost (B) Equilibrium price (C) Marginal cost (D) Average cost
›Reveal solutionSolution
Opportunity cost is also known as economic cost, so the answer is (A) Economic cost.
Opportunity cost is the value of the next-best alternative that has to be given up when a resource is used for a particular purpose. For example, if land is used to grow wheat, the opportunity cost is the value of the rice that could have been grown on it instead.
…
- CBSE 2025Set ANNUAL1 markMCQQ.TFC + TVC = ? (A) Total cost (B) Average cost (C) Marginal cost (D) None of these
›Reveal solutionSolution
TFC + TVC = Total Cost, so the answer is (A) Total cost.
A firm's total cost of production has two parts. Total Fixed Cost (TFC) does not change with output (rent, insurance, salary of permanent staff). Total Variable Cost (TVC) changes directly with the level of output (raw material, wages of casual labour, power).
…
- CBSE 2025Set ANNUAL1 markMCQQ.Which of the following curve has rectangular hyperbola shape? (A) Average variable cost curve (B) Total fixed cost curve (C) Average fixed cost curve (D) Total variable cost curve
›Reveal solutionSolution
AFC = TFC/output, and since TFC is constant, AFC continually falls, tracing a rectangular hyperbola, so (C) is correct.
In the RBSE/CBSE Class-12 production-and-costs chapter, Average Fixed Cost (AFC) = Total Fixed Cost ÷ Output. Total fixed cost is constant, so as output rises the fixed cost is distributed over more and more units, making AFC fall continuously.
…
- CBSE 2025Set ANNUAL1 markMCQQ.Difference between total cost and total variable cost is equal to - (A) Average cost (B) Total fixed cost (C) Marginal cost (D) Average fixed cost
›Reveal solutionSolution
Since TC = TFC + TVC, it follows that TC − TVC = TFC, so (B) is correct.
In the RBSE/CBSE Class-12 production-and-costs chapter, total cost in the short run has two parts:
- Total Fixed Cost (TFC) — does not change with output.
- Total Variable Cost (TVC) — rises with output.
Thus TC = TFC + TVC. Rearranging this identity:
…
- CBSE 2025Set ANNUAL1 markMCQQ.Which one of the following is true? The total variable cost is equal to:(a) The average variable cost x quantity(b) The average variable cost / quantity(c) The marginal variable cost x quantity(d) The marginal variable cost / quantity
›Reveal solutionSolution
Total Variable Cost = Average Variable Cost × quantity, so the answer is (a).
Average Variable Cost (AVC) is defined as total variable cost per unit of output: AVC = TVC ÷ Q. Rearranging this gives TVC = AVC × Q. Therefore total variable cost is equal to averag …
🎓Unlock everything free for 14 days
- ✓Full step-by-step solutions
- ✓Concept-first explanations
- ✓Methods, shortcuts & mistakes
- ✓PYQ mapping + timed mock tests
Full access for 14 days. No credit card required.