Biology · Ch 11 — Organisms and Populations
Population Attributes
Population Attributes
A population is more than just a collection of individuals. In nature, organisms of the same species rarely live in complete isolation. Instead, they form groups in a defined geographical area, sharing or competing for resources and, in most cases, potentially interbreeding. This group is what ecologists call a population. Even groups formed by asexual reproduction are treated as populations for ecological studies.
Examples of populations include all the cormorants in a wetland, rats in an abandoned dwelling, teakwood trees in a forest tract, bacteria in a culture plate, and lotus plants in a pond.
Why study populations? Although an individual organism is the one that directly faces a changed environment, it is at the population level that natural selection actually operates to evolve traits. Population ecology is therefore a crucial link between ecology, population genetics, and evolution.
Attributes that Belong to a Population, Not an Individual
A population has certain attributes that an individual organism does not. An individual is born and dies, but a population has rates of birth and death.
Birth rate and death rate are expressed as per capita (per individual) numbers. They represent the change in numbers relative to the existing members of the population.
- Birth rate example: If a pond had 20 lotus plants last year and 8 new plants are added through reproduction, the current population is 28. The birth rate is 8/20 = 0.4 offspring per lotus per year.
- Death rate example: If 4 individuals in a laboratory population of 40 fruit flies die during a week, the death rate is 4/40 = 0.1 individuals per fruit fly per week.
Sex ratio is another attribute. An individual is either male or female, but a population has a sex ratio — for instance, 60 per cent females and 40 per cent males.
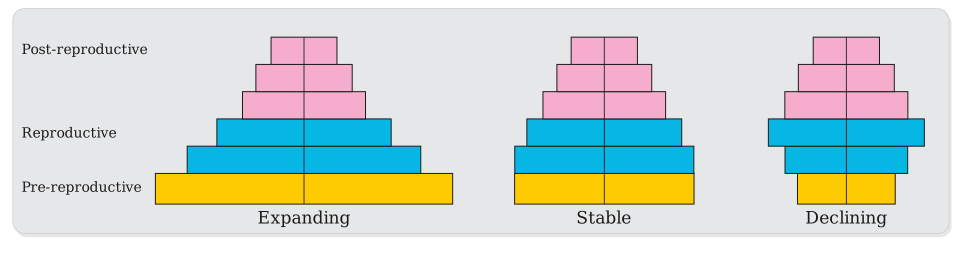
Age distribution is a third key attribute. A population at any given time is composed of individuals of different ages. When the percentage of individuals in each age group is plotted, the resulting structure is called an age pyramid. For human populations, these pyramids typically show the age distribution of males and females. The shape of the pyramid reveals the growth status of the population:
- Growing — a broad base of young individuals.
- Stable — a more even distribution across age groups.
- Declining — a narrow base of young individuals.
Population Size and Density
The size of a population tells us a lot about its status in the habitat. Whether we study competition, predator impact, or the effect of a pesticide, we evaluate it in terms of a change in population size. In nature, size can be as low as fewer than 10 (Siberian cranes at Bharatpur wetlands in any year) or run into millions (Chlamydomonas in a pond).
Population size is technically called population density (designated as N). Importantly, it need not always be measured in numbers alone.
- When numbers are misleading: In an area with 200 carrot grass (Parthenium hysterophorus) plants but only one huge banyan tree with a large canopy, stating that the banyan's population density is low relative to carrot grass underestimates the banyan's enormous role. In such cases, per cent cover or biomass is a more meaningful measure. …
Drawn by us to help you understand the concept clearly, and verified to make sure it's accurate. For exams, practice from your textbook's own diagram.
The figure shows three age pyramids for human populations, each a vertical bar chart made of six stacked horizontal bands running from the youngest age group at the bottom to the oldest at the top. The bands are colour-coded by life stage — one band for the pre-reproductive group, two bands for the reproductive group, and three bands for the post-reproductive group — and a thin vertical line runs down the centre of each pyramid purely to mark its axis of symmetry (the pyramids are not split into male and female halves).
The three pyramids are labelled Expanding, Stable and Declining, and each corresponds to a different growth status of a human population.
The Expanding pyramid has a broad base — the pre-reproductive band is the widest — and each band above is progressively narrower, giving a true triangular shape. This indicates a growing population: many young individuals will soon enter the reproductive years, leading to more births than deaths and a net increase in population size.
The Stable pyramid has bands of roughly similar width from base to the reproductive group, tapering only in the post-reproductive bands at the top. This represents a population whose pre-reproductive and reproductive numbers are balanced, so its size stays roughly constant over time.
The Declining pyramid has a narrower base than its middle (reproductive) bands, giving it an urn-like shape. This shows a declining population: fewer young individuals are entering the population than there are individuals already in the reproductive and post-reproductive groups, so the population will shrink in the future. …