Business Mathematics and Basic Statistics · Ch 16 — Bivariate Statistics — Correlation and Regression
Pearson's Correlation Coefficient
Pearson's Correlation Coefficient
Covariance tells us the direction in which two variables move together, but its size is tied to whatever units and happen to be measured in, so a covariance of, say, 1.2 carries no meaning on its own — is that a strong relationship or a weak one? Karl Pearson's correlation coefficient fixes this by dividing the covariance by the product of the two variables' own standard deviations, which cancels out the units and squeezes the result onto a fixed scale.
Pearson's Correlation Coefficient
where are the standard deviations of and . Always .
- close to : a strong positive linear relationship (as increases, tends to increase too).
- close to : a strong negative linear relationship (as increases, tends to decrease).
- close to : little or no linear relationship (the variables may still be related in a non-linear way that does not detect).
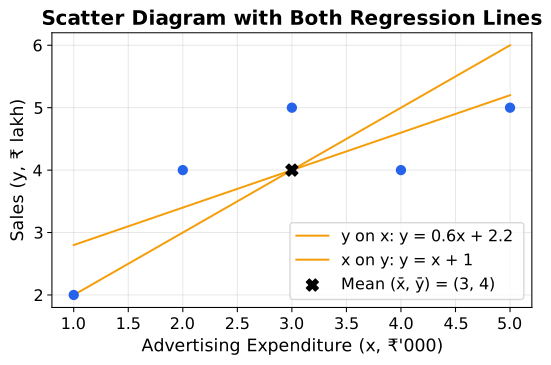
The geometric point of view. Plotting every pair as a point on a graph gives a scatter diagram, and Pearson's has a direct visual meaning on it: the closer the plotted points cluster around a single straight line, the closer is to 1; an upward-sloping cluster gives a positive , a downward-sloping cluster gives a negative , and a shapeless cloud of points with no visible line gives an close to . This geometric picture is exactly why is described as measuring the strength of linear association — it is, in effect, measuring how tightly the data hugs its own best-fitting straight line.
A unit-free measure of the strength and direction of the linear relationship between two variables, , alw …
A graph plotting every paired observation as a point; the shape and tightness of the resulting cloud of points is the geometric picture behind Pears …