Biology · Ch 11 — Photosynthesis in Higher Plants
How many Types of Pigments are Involved in Photosynthesis?
How many Types of Pigments are Involved in Photosynthesis?
Looking at plants, you may have wondered why there are so many shades of green in their leaves, even on the same plant. We can answer this by separating the leaf pigments through paper chromatography. A chromatographic separation of the leaf pigments shows that the colour we see in leaves is not due to a single pigment but to four pigments:
- Chlorophyll a — bright or blue green in the chromatogram.
- Chlorophyll b — yellow green.
- Xanthophylls — yellow.
- Carotenoids — yellow to yellow-orange.
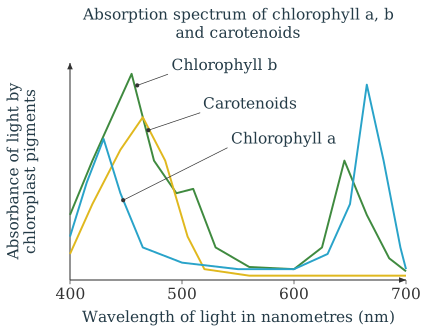
Pigments are substances that have the ability to absorb light at specific wavelengths. Chlorophyll a is, in fact, the most abundant plant pigment in the world. If we study the graph showing the ability of chlorophyll a to absorb light of different wavelengths — its absorption spectrum — we find that it shows maximum absorption in the blue and the red regions of the visible spectrum (the wavelength being measured against the familiar VIBGYOR).
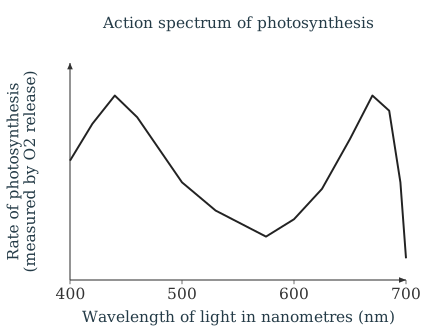
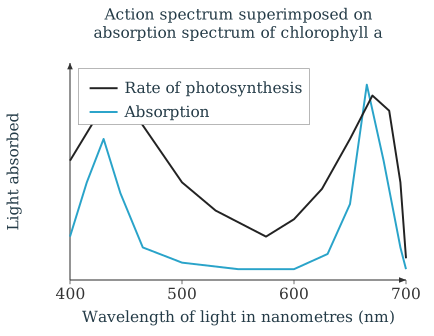
We can also plot the action spectrum of photosynthesis, which shows the wavelengths at which the rate of photosynthesis is highest in a plant. The wavelengths at which chlorophyll a absorbs maximally — in the blue and the red regions — also show the higher rates of photosynthesis. From this we conclude that chlorophyll a is the chief pigment associated with photosynthesis. However, there is not a complete one-to-one overlap between the absorption spectrum of chlorophyll a and the action spectrum of photosynthesis. This is because most, though not all, of the photosynthesis takes place in the blue and red regions of the spectrum; some also occurs at other wavelengths of the visible spectrum. …
Drawn by us to help you understand the concept clearly, and verified to make sure it's accurate. For exams, practice from your NCERT textbook's own diagram.
This graph shows how strongly the chloroplast pigments absorb light of different wavelengths across the visible spectrum, with absorbance on the vertical axis and wavelength on the horizontal axis. Separate curves are drawn for chlorophyll a, chlorophyll b and the carotenoids. Chlorophyll a absorbs most strongly in the blue and the red regions, with low absorption in the green middle region, which is why leaves appear green. Chlorophyll b and the carotenoids absorb at somewhat different wavelengths, acting as accessory pigments. Together the curves show that the pigments c …
Drawn by us to help you understand the concept clearly, and verified to make sure it's accurate. For exams, practice from your NCERT textbook's own diagram.
This graph shows the action spectrum of photosynthesis, plotting the rate of photosynthesis, measured by O2 release, against the wavelength of light. The curve reveals two broad peaks of high activity, one in the blue region and another in the red region of the visible spectrum, with a dip in the green-yellow middle range. These are the wavelengths at which photosynthesis proceeds fastest. The shape closely follows where chlorophyll a absorbs light most strongly, confirming that chlorophyll a is the chief pigment driving the process, while the …
Drawn by us to help you understand the concept clearly, and verified to make sure it's accurate. For exams, practice from your NCERT textbook's own diagram.
This graph places two curves on the same axes, wavelength on the horizontal and the response on the vertical, to compare them directly. One curve is the rate of photosynthesis (the action spectrum) and the other is the light absorbed by chlorophyll a (its absorption spectrum). Both curves peak in the blue and red regions, so they overlap closely and confirm that chlorophyll a is the main pigment of photosynthesis. However, the match is not a complete one-to-one overlap: photosynthesis also occurs at some wavelengths where chlorophyll a absorbs weakly. This gap is ex …