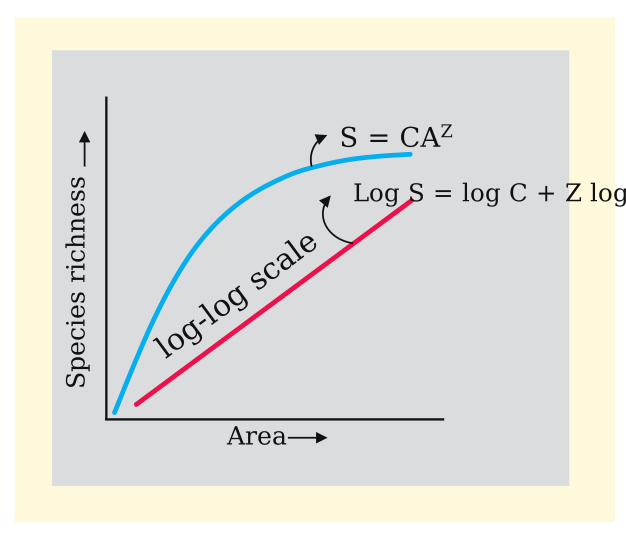
Q.(a) The graph given below shows species-area relationship of a certain region.
🔒You're viewing a preview — the full solution, concept, methods & PYQ mapping are locked.
🔒 Start your 14-day free trial to unlock the full solution →Part (a)Concept understanding — Species Area Relationship
The Species Area Relationship: A First Look
Imagine you are walking through a small park near your home. You might spot a few birds, some insects, and a handful of plant species. Now imagine that same walk through a large forest reserve — hundreds of times bigger. Would you expect to see more kinds of birds, more types of insects, more varieties of trees? Almost certainly yes. That simple, intuitive observation is the seed of the Species Area Relationship.
What It Means
The Species Area Relationship (often abbreviated as SAR) is a pattern ecologists have observed across the natural world: as the area you sample increases, the number of species you find also increases. It is not a vague guess — it is a consistent, well-documented relationship that holds true for most groups of organisms, from plants and birds to insects and mammals.
Why does this happen? A larger area typically contains more habitats — forests, grasslands, wetlands, rocky outcrops — and each habitat supports its own set of species. A bigger area also tends to have more individuals, and with more individuals you are more likely to encounter rare species that might be absent from a small patch. In short, area acts as a rough proxy for ecological diversity and complexity.
Key Points to Remember
- The relationship is positive: bigger area → more species.
- It is not linear — doubling the area does not double the number of species. The increase slows down as area gets very large.
- The pattern holds across scales: from a single leaf (hosting tiny insects and fungi) to an entire continent.
The NCERT textbook for Class 12 Biology (Chapter 15, Biodiversity and Conservation) introduces this concept in the context of biodiversity patterns. It states that the relationship between species richness and area is described by a curve that rises rapidly at first and then flattens. The textbook does not require you to memorise any equation — only to understand the general trend and its implications.
Why It Matters
The Species Area Relationship is not just an academic curiosity. It has real-world consequences, especially for conservation.
- Designing protected areas: If you want to preserve a certain number of species, you need to know how much area is required. A small reserve may protect only a fraction of the region's biodiversity.
- Predicting extinctions: When a habitat is destroyed or fragmented, the remaining area shrinks. Using the SAR, ecologists can estimate how many species are likely to be lost as a result.
- Understanding island biology: The relationship was first studied on islands, where area is clearly defined and isolation limits immigration. The same logic applies to "habitat islands" — patches of forest surrounded by farmland, or national parks surrounded by cities. …
Part (b)Concept understanding — Ecological Concepts
Ecological Concepts: Zooming Out From Organism to Biosphere
Point a camera at a single deer grazing in a forest, and you are looking at an organism. Zoom out a little and you see the whole herd of deer sharing that forest — a population. Zoom out further and the tigers, grasses, insects and fungi living alongside that herd come into frame — a community. Pull back once more and you see the community together with the soil, water, sunlight and air it depends on — an ecosystem. Keep pulling back and entire regions of similar ecosystems (all the world's tropical forests, say) form a biome, and every biome on Earth together makes up the biosphere.
This is the idea of levels of ecological organisation — the same living world, examined at successively larger scales. The NCERT Class XII Biology ecology unit (Chapters 11–13) is built around exactly this zoom-out: Chapter 11 (Organisms and Populations) stays at the organism/population scale, Chapter 12 (Ecosystem) zooms out to the community-plus-environment scale, and Chapter 13 (Biodiversity and Conservation) zooms out again to ask how much variety of life exists and how to protect it. "Ecological Concepts" as a bucket covers facts that sit at any of these scales — not one single narrow idea, but the connected vocabulary ecologists use to describe life at every zoom level.
If a question is specifically about who benefits and who loses when two species interact (mutualism, competition, predation, parasitism, commensalism, amensalism), that is covered in depth in the Ecological Interactions concept. This concept covers the broader structural and functional ideas around it — organisation, ecosystem function, and the systems that move matter and energy through it.
Populations: The First Zoom-Out From the Individual
A population is a group of individuals of the same species living in a defined geographical area at a given time, capable of interbreeding. Because it is a group and not a single organism, a population has properties an individual cannot have on its own — birth rate and death rate (measured per capita, not as raw counts), a sex ratio, an age distribution, and a population density (the size of the population relative to a unit of space). These "group-level" attributes are exactly what distinguishes population ecology from studying one organism's physiology.
Ecosystem Structure: What an Ecosystem Is Made Of
An ecosystem is a functional unit of nature in which living organisms interact with each other and with their physical surroundings. Every ecosystem — a pond, a forest, a crop field, even an aquarium — is built from the same two kinds of components:
- Abiotic components — the non-living inorganic and organic materials: air, water, soil, and the nutrients dissolved in them.
- Biotic components — the living organisms, organised by their functional role: producers (autotrophs that fix solar energy), consumers (heterotrophs that eat producers or each other), and decomposers (fungi and bacteria that break down dead matter).
Two things give an ecosystem its physical shape: its species composition (which plant and animal species are present) and its stratification — the vertical layering of species at different heights, such as tall trees forming the top canopy of a forest, shrubs below them, and grasses and herbs at the ground.
An ecosystem is studied as a working unit through four linked processes: productivity, decomposition, energy flow, and nutrient cycling. Every "how does an ecosystem function" question is really asking about one of these four.
Productivity: How Fast an Ecosystem Makes New Matter
Primary productivity is the rate at which producers capture solar energy and convert it into organic (biomass) matter.
- Gross Primary Productivity (GPP) — the total rate of production of organic matter, i.e. the total solar energy fixed by all producers.
- Net Primary Productivity (NPP) — what is left of GPP after the producers themselves use some of it up in their own respiration: NPP = GPP − Respiration losses (R). NPP is the biomass actually available to the consumers (herbivores and decomposers) of the ecosystem.
- Secondary productivity is the rate at which consumers assimilate the food energy they take in from producers or from other consumers.
Decomposition: Breaking Matter Back Down
Decomposers convert the complex organic compounds in dead plant and animal remains ("detritus") back into simple inorganic nutrients, so those nutrients can be reused by producers. This happens in three overlapping steps:
- Fragmentation — detritivores (like earthworms) physically break detritus into smaller particles.
- Leaching — water-soluble inorganic nutrients seep down through the soil and are lost from the topsoil layer as precipitates.
- Catabolism — bacterial and fungal enzymes chemically break down the remaining detritus into simpler inorganic substances.
Partial decomposition leaves behind a dark, colloidal, highly microbe-resistant substance called humus, which acts as a slow-release nutrient reservoir; its further breakdown to release inorganic nutrients is called mineralisation. Decomposition is largely an oxygen-requiring process, is slower when detritus is rich in lignin/chitin, and is faster when it is rich in nitrogen and simple sugars — warm, moist conditions favour it, while cold and waterlogged (anaerobic) conditions suppress it and let organic matter accumulate.
Energy Flow and Ecological Pyramids
Unlike nutrients, energy in an ecosystem flows in one direction only — from the sun, into producers, and then into successive consumers — and is progressively lost as heat at every transfer; it is never recycled back to the producers the way a nutrient is. Because a real ecosystem rarely has a single, unbranched sequence of "who eats whom," feeding relationships form an interconnected food web rather than one isolated food chain.
Ecological pyramids represent this trophic structure visually (producers at the base, successive consumers stacked above):
A pyramid of energy is always upright — it can never be inverted, because energy is always lost as heat at each transfer, so a lower trophic level must always contain more energy than the level above it. Pyramids of numbers and biomass can be inverted in some ecosystems — the classic example is a marine ecosystem, where the biomass of fish (consumers) can exceed the biomass of the phytoplankton (producers) that support them, because the phytoplankton reproduce and get eaten so fast.
Nutrient (Biogeochemical) Cycling …
Part (a)
(i) The graph shows the species–area relationship: as the area of a region increases, its species richness increases (steeply at first, then levelling off). On a log–log scale this fits a straight line, log S = log C + Z·log A (i.e. S = C·A^Z), where Z is the slope. It means larger areas support more species because they offer more habitats and resources. …
Part (a): the graph is the species–area relationship (S = C·A^Z; richness rises with area); a road fragments the habitat, so richness falls.
Part (b): Tilman's long-term plot experiments showed more species → greater stability (and productivity).
Part (a)
- What the graph represents
The graph shows the species–area relationship: within a region, the number of species (species richness, S) increases as the area (A) studied increases — rising rapidly for small areas and then flattening. First noted by Alexander von Humboldt, this relationship is described by:
where C is a constant (intercept) and Z is the slope (regression coefficient), typically 0.1–0.2 for small areas within a region. Larger areas hold more species because they provide more varied habitats, more resources and larger, more stable populations.log S = log C + Z·log A, i.e. S = C·A^Z
- Impact of building a road that divides the region Constructing the road causes habitat fragmentation — the continuous region is split into two smaller patches. Even if the total area lost is small, species richness decreases, because:
- each fragment is a smaller effective area, which by the species–area relationship supports fewer species;
- the road isolates the populations, blocking movement, reducing gene flow and preventing recolonisation, and
- new edges bring altered microclimate, invasive species and predators (edge effects). …
Showing the 12 most recent of 28 on this concept.
- CBSE 2026Set 57/1/11 markMCQQ.In an ecosystem, different species occupy different levels and vertical distribution of species is found. This is called _________. (A) Stratification (B) Layering (C) Fragmentation (D) Population
›Reveal solutionSolution
The vertical distribution of different species across distinct height levels in an ecosystem is called stratification.
When you walk into a forest, you're not looking at a flat carpet of life—you're seeing a three-dimensional structure where different organisms live at different heights, each layer buzzing with its own community. This vertical arrangement is one of the most elegant organizing principles in ecology.
Think of a tropical rainforest. The tallest trees form an emergent layer, their crowns breaking through to full sunlight. Below them spreads the main canopy, a dense roof where most of the forest's photosynthesis happens and countless birds, insects, and epiphytes make their home. Beneath that lies the understory, a shadier zone of smaller trees and saplings adapted to low light. Closer to the ground, shrubs and herbs form another layer, and finally the forest floor itself—dark, humid, rich with decomposers breaking down leaf litter.
Each of these layers represents a different microhabitat with its own temperature, humidity, and light conditions. A canopy-dwelling monkey and a ground-dwelling porcupine might live in the same forest, but they occupy entirely different vertical zones—different strata. This isn't random; it's the result of species evolving to exploit specific niches at specific heights, reducing competition and allowing more species to coexist in the same horizontal space.
NoteStratification isn't limited to forests. Aquatic ecosystems show it too—think of the sunlit surface zone, the twilight middle depths, and the dark ocean floor, each supporting different communities adapted to pressure, light, and temperature at that depth. …
- CBSE 2026Set 57/3/11 markMCQQ.Which of the following is not a functional unit of an ecosystem ? (A) Energy flow (B) Decomposition (C) Stratification (D) Productivity
›Reveal solutionSolution
Stratification is a structural characteristic of an ecosystem, not a functional unit. The key functional units are productivity, decomposition, energy flow, and nutrient cycling.
An ecosystem is a fascinating and complex system where living organisms interact with each other and with their non-living environment. Think of a forest, a pond, or even a small patch of garden – each is an ecosystem, a self-sustaining unit. To truly understand how these systems operate, we look at their fundamental processes, often referred to as their functional units. These are the dynamic activities that keep the ecosystem alive and thriving.
The core functional units of any ecosystem are the processes that govern the flow of energy and the cycling of nutrients. These processes ensure the continuous existence and health of the biotic community within its abiotic surroundings. Let's explore the primary functional units:
-
Productivity: This refers to the rate at which biomass is produced in an ecosystem. It's essentially how much organic matter is generated.
- Primary productivity is the rate at which producers (like plants) convert solar energy into organic compounds through photosynthesis. It's the foundation of almost all ecosystems.
- Secondary productivity is the rate at which consumers (herbivores, carnivores) assimilate energy and form new organic matter from the food they eat.
ImportantProductivity is a measure of the ecosystem's capacity to generate organic material, which forms the basis of the food web.
-
Decomposition: This is the vital process by which decomposers, primarily bacteria and fungi, break down dead organic matter (detritus) into simpler inorganic substances. This process is crucial because it recycles nutrients back into the soil or water, making them available for producers once again. Without decomposition, nutrients would be locked up in dead organisms, and life would eventually cease.
-
Energy Flow: Energy is the driving force of an ecosystem. It flows unidirectionally, meaning it moves from the sun to producers, then to various levels of consumers, and finally to decomposers. Energy is captured by producers, transferred through different trophic levels (feeding levels), and a significant portion is lost as heat at each transfer. This continuous flow ensures that all organisms receive the energy they need to survive. …
-
- CBSE 2026Set ANNUAL1 markMCQQ.Which of the following is not a functional unit of the ecosystem?(a) Energy flow(b) Decomposition(c) Stratification(d) Productivity
›Reveal solutionSolution
Unlike energy flow, decomposition, and productivity, which are dynamic functional processes of an ecosystem, stratification is a structural feature describing vertical layering of organisms.
The functional aspects (functional units) of an ecosystem are generally described as: productivity (the rate of biomass generation), decomposition (breakdown of dead organic matter), energy flow (the unidirectional movement of energy from sun through trophic levels), and nutrient cycling. Stratification, in contrast, refers to the vertical layering/organisation of different species within a community (e.g., canopy, shrub, and herb layers in a f …
- CBSE 2025Set F1 markMCQQ.Which of the following is a biotic component of ecosystem?(a) Air(b) Sunlight(c) Water(d) Producer
›Reveal solutionSolution
Producers are the biotic (living) component; air, sunlight and water are abiotic.
An ecosystem has two kinds of components. Abiotic (non-living) components include physical and chemical factors such as air, sunlight, water, temperature and soil minerals. Biotic (living) components include producers (green plants/autotrophs), consumers (herbiv …
- CBSE 2025Set ANNUAL1 markMCQQ.The relation between species richness and area for a wide variety of taxa on a logarithmic scale is a(a) Rectangular hyperbola(b) Straight line(c) Sigmoid curve(d) Sine curve
›Reveal solutionSolution
On a log-log plot, species richness rises linearly with area (log S = log C + Z log A); on a normal (non-log) scale it is a rectangular hyperbola.
Ecologists have found that, within a region, species richness (S) increases with explored area (A), but only up to a certain limit; beyond this, the addition of new species with increasing area is minimal. On a normal (arithmetic) scale, this species-area relationship for a wide variety of taxa (plants, birds, fish) turns out to be a curve — specifically, a rectangular hyperbola.
…
- CBSE 2024Set BOTANY1 markQ.Correct the statement, if necessary, by changing the underlined word(s) only: Vertical distribution of different species of plants occupying different levels in a forest is called concentration.
›Reveal solutionSolution
The correct term for this vertical layering of species is stratification, not concentration.
In a community such as a forest, different species occupy different vertical layers based on their height and light requirements — for example, tall trees form the top canopy layer, below them are shrubs, then herbs, and finally ground-hugging mosses/grasses form the lowest layer. This vertical distribution of species at different heights is known as stratification, and it allows the community to make optimal use of …
- CBSE 2024Set ANNUAL1 markMCQQ.Observe the graph and select correct option (species richness vs. area, log-log scale, two curves A and B):(a) Line 'A' represents S = CA²(b) Line 'B' represents log C = log A + Z log S(c) Line A represents S = CA^Z(d) Line B represents log S = log Z + C log A
›Reveal solutionSolution
On a log-log plot, the species-area relationship follows the power law S = C·A^Z, which appears as a straight line; the plain (non-log) curve rises steeply then plateaus.
The species-area relationship describes how species richness (S) increases with sampled area (A) according to S = C·A^Z, where C is a constant (species density) and Z is the slope reflecting the rate of increase (regression coefficient). When plotted on ordinary axes, this relationship appears as a curve that rises steeply and then flattens (a rectangular-hyperbola-like shape) — matching curve A in the figure. When the same relationship is plotted on a log-log scale, taking logarithms of both sides gives l …
- CBSE 2023Set TERM21 markMCQQ.The two components of an ecosystem are:(a) Plants and Animals(b) Weeds, Trees, Animals and Man(c) Energy flow and Mineral cycling(d) Biotic and Abiotic
›Reveal solutionSolution
An ecosystem is made up of two fundamental components: the biotic component (all living organisms) and the abiotic component (non-living physical and chemical factors).
An ecosystem is a functional unit of nature comprising living organisms and their non-living physical environment interacting together. Its two components are: the biotic component, consisting of producers, consumers and decomposers (plants, animals, microbes), and the abiotic component, consisting of physical/chemical factors such as temperature, rainfall, light, soil, and in …
- CBSE 2023Set ANNUAL1 markMCQQ.The biogeochemical cycle means(a) the cycling of water(b) the cycling of energy in an ecosystem, the cycling of gases(c) the cycling of nutrients in an ecosystem(d) the cycling of gases between plants and the atmosphere
›Reveal solutionSolution
Biogeochemical cycle = cycling of nutrients through the ecosystem.
A biogeochemical cycle is the movement of a chemical element or nutrient (bio = living, geo = rocks/soil/air/water) repeatedly between the living organisms and the non-living environment of an ecosystem. Examples are the carbon, nitrogen and phosphorus cycle …
- CBSE 2023Set ANNUAL1 markMCQQ.Which of the following uses inorganic material?(a) autotroph(b) saprophyte(c) heterotroph(d) decomposer
›Reveal solutionSolution
Autotrophs use inorganic material to make food.
Autotrophs (mainly green plants and some bacteria) take in inorganic raw materials such as carbon dioxide, water and mineral salts and, using energy (light in photosynthesis or chemical energy in chemosynthesis), build them into organic food. Heterotrophs, saprophytes and …
- CBSE 2023Set ANNUAL1 markMCQQ.Lichens are pioneers in the succession of which?(a) hydrosere(b) lithosere(c) xerosere(d) both(b) and (c)
›Reveal solutionSolution
Lichens pioneer succession on bare rock — a lithosere, which is a kind of xerosere.
Ecological succession starting on bare rock is called a lithosere; because bare rock is a very dry (xeric) habitat, a lithosere is a type of xerosere (succession beginning in dry conditions). Lichens are the pioneer community on bare rock: they secrete acids that weather the rock and, on dying, add organic matt …
- CBSE 2023Set ANNUAL1 markMCQQ.Which of the following is not a producer?(a) Agaricus(b) Nostoc(c) Volvox(d) Spirogyra
›Reveal solutionSolution
Agaricus is a fungus (decomposer), so it is not a producer.
Producers are autotrophic organisms containing chlorophyll that fix light energy into organic food. Nostoc (a cyanobacterium), Volvox and Spirogyra (green algae) all photosynthesise and are producers. Agaricus is a mushroom, i.e. a fungus, …
🎓Unlock everything free for 14 days
- ✓Full step-by-step solutions
- ✓Concept-first explanations
- ✓Methods, shortcuts & mistakes
- ✓PYQ mapping + timed mock tests
Full access for 14 days. No credit card required.