Business Economics · Ch 3 — Production and Cost Analysis
Cost Curves and Their Relationships
Cost Curves and Their Relationships
The per-unit cost curves and the way they relate to one another are the most heavily examined part of this chapter. All of it follows from three total-cost concepts — , and — and the four per-unit concepts derived from them.
The Total Cost Curves
- is a horizontal straight line — fixed cost is the same at every output, including zero.
- starts from the origin (zero at zero output) and rises as output rises, typically flattening first (when marginal cost is falling) and then getting steeper (when marginal cost is rising).
- , so the curve has the same shape as but starts at the height of on the vertical axis (its value at zero output equals ). The vertical gap between and is always exactly .
The Four Per-Unit Cost Curves
| Curve | Formula | Typical shape |
|---|---|---|
| Average Fixed Cost | Falls continuously as output rises (a rectangular hyperbola); never touches either axis | |
| Average Variable Cost | U-shaped — falls, reaches a minimum, then rises | |
| Average (Total) Cost | U-shaped — falls, reaches a minimum, then rises | |
| Marginal Cost | U-shaped — falls, reaches a minimum, then rises (steeper than the averages) |
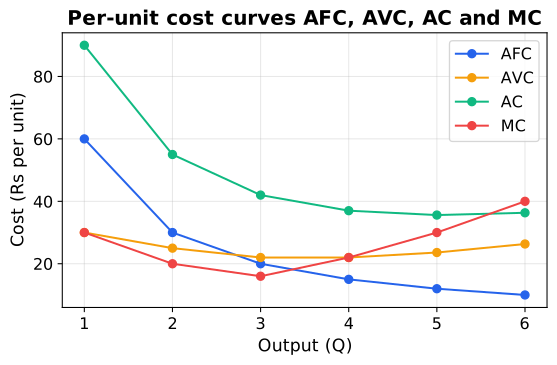
Why AFC Falls Continuously
is a fixed number divided by a rising output, so it falls continuously and gets closer and closer to the horizontal axis without ever touching it (a rectangular hyperbola). This is why the gap between the and curves — which equals — narrows as output rises but never closes.
The Key MC-AC and MC-AVC Relationship
The single most important result of this chapter:
- The curve cuts both the curve and the curve exactly at their minimum points, and cuts them from below.
- When , the curve is falling; when , the curve is rising; when , is at its minimum. Exactly the same holds for and . …
— falls continuously as output rises (a rectangular hyperbola) and approaches, but never touc …
— U-shaped: falls, reaches a minimum, …
— U-shaped; lies above AVC by a vertical distance equal to AFC, which shrin …
MC cuts both AVC and AC from below at their minimum points; MC below the average means the average is falling, MC abov …