Q.Draw a diagram of population growth curve for Logistic growth also write down the equation of it.
You're viewing a preview — the full solution, concept, methods & PYQ mapping are locked.
Start your 14-day free trial to unlock the full solution →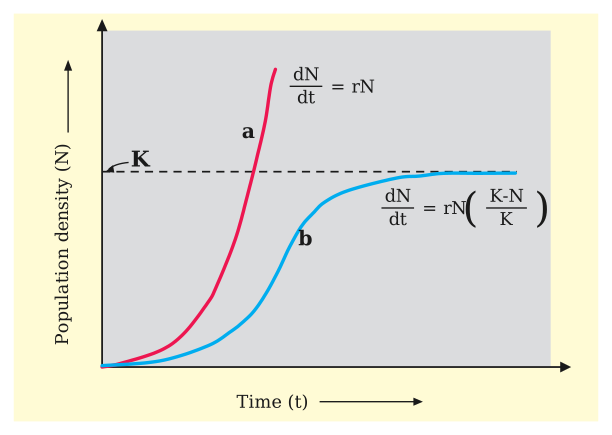
Logistic growth occurs when resources are limited; the resulting sigmoid (S-shaped) curve shows growth slowing down and eventually stabilising at the habitat's carrying capacity.
Diagram (described): If population size (N) is plotted on the y-axis against time (t) on the x-axis, the logistic growth curve starts with a slow initial rise (lag phase, when N is small), followed by a steep, near-exponential rise through the middle portion (as resources are still relatively abundant), and then the curve gradually flattens and levels off into a plateau as N approaches K, the carrying capacity of the environment - giving the characteristic S-shaped (sigmoid) curve, in contrast to the unrestricted J-shaped curve of exponential growth.
Equation: dN/dt = rN[(K - N)/K] …
Unlock everything free for 14 days
- Full step-by-step solutions
- Concept-first explanations
- Methods, shortcuts & mistakes
- PYQ mapping + timed mock tests
Full access for 14 days. No credit card required.