Question of 54
Q.Explain the different segments of standard ECG with the help of diagrammatic presentation of a standard ECG. OR Describe the structure of Forebrain.
Haryana BsehBoard of School Education Haryana (Senior Secondary Part-I / Class 11) 2021Subjective· 5mImportance★★★★★
0% · 0/54 Questions
You're viewing a preview — the full solution, concept, methods & PYQ mapping are locked.
Start your 14-day free trial to unlock the full solution →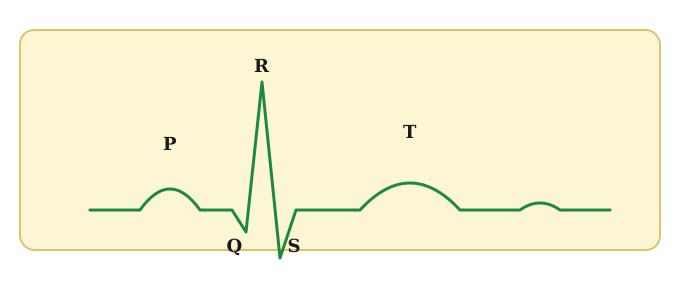
The ECG's P wave, QRS complex and T wave mark the electrical events of atrial and ventricular depolarisation/repolarisation during one cardiac cycle.
An electrocardiogram (ECG) is a graphical record of the electrical activity of the heart during a cardiac cycle, obtained using electrodes placed at specific points on the body and displayed as a trace of voltage (on the y-axis) against time (on the x-axis). A standard ECG for one heartbeat shows the following segments, in sequence:
- P wave: a small upward deflection representing the depolarisation (electrical activation) of the atria, which triggers atrial contraction.
- P-Q (or P-R) segment/interval: the short flat interval representing the time taken for the electrical impulse to travel from the SA node through the AV node into the ventricles.
- QRS complex: a sharp, tall spike (Q dips down, R spikes up, S dips down again) representing depolarisation of the ventricles, which triggers ventricular contraction; it also coincides with (and masks) the repolarisation of the atria.
- S-T segment: represents the period during which the ventricles remain depolarised/contracted. …
Unlock everything free for 14 days
- Full step-by-step solutions
- Concept-first explanations
- Methods, shortcuts & mistakes
- PYQ mapping + timed mock tests
Full access for 14 days. No credit card required.