Chemistry · Ch 3 — Thermodynamics
Is Decrease in Enthalpy a Criterion for Spontaneity?
Is Decrease in Enthalpy a Criterion for Spontaneity?
Is Decrease in Enthalpy a Criterion for Spontaneity?
When we observe phenomena like water flowing downhill or a stone falling to the ground, we see a net decrease in potential energy in the direction of change. By analogy, we might be tempted to conclude that a chemical reaction is spontaneous in a given direction because there is a decrease in energy — as in exothermic reactions.
Consider these examples:
In each case, the enthalpy of the products is lower than that of the reactants. The postulate that a decrease in enthalpy drives spontaneous change seems reasonable based on this evidence.
But now examine these reactions:
…
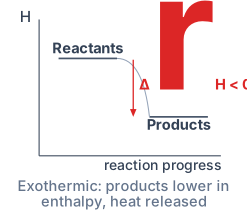
Drawn by us to help you understand the concept clearly, and verified to make sure it's accurate. For exams, practice from your textbook's own diagram.
What Fig. 5.10 Actually Shows
The diagram is a simple enthalpy profile: a plot with Enthalpy () on the vertical axis and Reaction coordinate (a measure of progress from reactants to products) on the horizontal axis. Two horizontal lines appear — one labelled Reactants at a higher enthalpy level, another labelled Products at a lower level. A vertical downward arrow connects the two levels, annotated with (or simply ), indicating that heat is released to the surroundings.
There is no curve or hump representing activation energy — this is not an energy barrier diagram. The figure is deliberately simple: it shows only the net enthalpy change between the start and end of a reaction at constant pressure.
The reaction coordinate axis has no numerical scale. It merely indicates direction: left-to-right means the reaction proceeds from reactants to products. The slope or shape of any connecting line is irrelevant here — only the vertical drop matters.
The Physical Idea
The figure teaches one core concept: for an exothermic reaction, the enthalpy of the products is lower than the enthalpy of the reactants. The difference appears as heat given off to the surroundings. This is why exothermic reactions feel hot — energy flows out of the system.
The downward arrow represents , the enthalpy change of reaction. Because the arrow points down (products have less enthalpy), is negative. The textbook defines this quantity as:
where and are the stoichiometric coefficients of products and reactants respectively, and is the molar enthalpy of each substance.
A common mistake is to think the arrow shows the direction of heat flow. It does not — it shows the magnitude and sign of the enthalpy change. Heat flows out of the system (to surroundings) when is negative.
The Key Formula This Figure Supports
The figure is the visual foundation for the standard enthalpy of reaction:
Here:
- = standard enthalpy change for the reaction (kJ mol⁻¹)
- = standard enthalpy of formation of a compound (kJ mol⁻¹)
- = stoichiometric coefficients from the balanced equation
- The superscript denotes standard state conditions (1 bar pressure, specified temperature, usually 298 K)
The diagram makes this formula intuitive: if you know the enthalpy levels of reactants and products (via their values), the vertical drop (or rise) gives you directly.
For an exothermic reaction, the sum on the right (products) is smaller than the sum on the left (reactants), so comes out negative — exactly as the downward arrow in Fig. 5.10 shows.
Why This Matters for Problem-Solving
When you encounter a thermochemical equation like: …
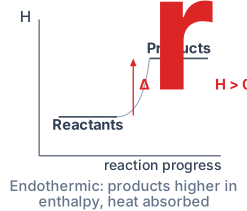
Drawn by us to help you understand the concept clearly, and verified to make sure it's accurate. For exams, practice from your textbook's own diagram.
Fig. 5.10(b) is the mirror image of the exothermic diagram in Fig. 5.10(a). The axes are the same — enthalpy vertically, reaction progress horizontally — but now the Products level sits higher than the Reactants level. Climbing from the lower reactant level to the higher product level costs energy, so : the reaction absorbs net heat from the surroundings.
The textbook pairs this with reactions like () — endothermic, yet spontaneous. …