Q.A drunkard walking in a narrow lane takes 5 steps forward and 3 steps backward, followed again by 5 steps forward and 3 steps backward, and so on. Each step is 1 m long and requires 1 s. Plot the x-t graph of his motion. Determine graphically and otherwise how long the drunkard takes to fall in a pit 13 m away from the start.
🔒You're viewing a preview — the full solution, concept, methods & PYQ mapping are locked.
🔒 Start your 14-day free trial to unlock the full solution →Concept understanding — One Dimensional Motion
One Dimensional Motion
Imagine you're standing on a long, perfectly straight railway track. A train moves along it — it can only go forward or backward. It cannot turn left, right, up, or down. That's the core idea: motion confined to a single straight line.
The Intuition
In the real world, a ball thrown across a room moves in three dimensions — it goes forward, sideways, and up-down. But many problems in physics are simpler. We deliberately restrict motion to one dimension (1D) to understand the fundamental laws without the clutter of angles and curves.
Think of:
- A car moving on a straight highway (no turns).
- A lift going up or down a shaft.
- A ball dropped straight down from a height.
- A puck sliding on a frictionless straight track.
In each case, the object's position can be described by just one number — its distance from a fixed point (the origin) along that line.
The Precise Statement
One Dimensional Motion is motion in which the position of an object can be completely described using a single coordinate axis (usually the x-axis or y-axis). The object moves only along that straight line.
This means:
- The path is a straight line.
- The direction is either positive (say, to the right or upward) or negative (left or downward).
- All vector quantities (displacement, velocity, acceleration) have only two possible directions — forward or backward.
The Three Key Quantities
To describe 1D motion precisely, we use three quantities:
-
Position (x or y) — where the object is relative to the origin.
Example: x=+5 m means 5 metres to the right of the origin.
-
Displacement (Δx) — change in position:
Δx=xfinal−xinitial
This is a vector — it has a sign. If you move from x=2 m to x=7 m, Δx=+5 m. If you move back to x=3 m, Δx=−4 m.
- Velocity (v) — rate of change of position:
v=ΔtΔx
Average velocity has a sign. Instantaneous velocity is the slope of the position-time graph.
- Acceleration (a) — rate of change of velocity:
a=ΔtΔv
Again, a signed quantity. Positive acceleration doesn't always mean speeding up — it means velocity is becoming more positive (or less negative).
The Equations of Motion (Constant Acceleration)
For the special (and very common) case of constant acceleration, we have three equations that connect these quantities. They are the equations of motion for 1D:
v=u+at
s=ut+21at2
v2=u2+2as
Where:
- u = initial velocity
- v = final velocity
- a = constant acceleration
- t = time
- s = displacement
These equations only work when acceleration is constant. If acceleration changes, you cannot use them directly — you'd need calculus or graphical methods.
A Simple Example …
Concept: Periodic 1-D motion — the pit can be reached mid-surge, not just at the end of a full forward-backward cycle.
Step 1. Each cycle (5 steps forward + 3 steps back) takes 8 s and gives a net advance of 5−3=2 m. But checking only the position at the end of each cycle misses the fact that during a forward surge, the drunkard reaches a peak 5 m above the previous cycle's floor — higher than his net position.
Step 2. Position at the end of each full cycle:
| Cycles completed | Time (s) | Position (m) |
|---|---|---|
| 1 | 8 | 2 |
| 2 | 16 | 4 |
| 3 | 24 | 6 |
| 4 | 32 | 8 |
The drunkard advances a net +2 m every 8 s cycle, but reaches the 13 m pit during a forward surge — he falls into the pit at t = 37 s.
Setting up the motion
Each step is 1 m and takes 1 s.
- 5 steps forward → +5 m in 5 s.
- 3 steps backward → −3 m in 3 s.
So one full cycle takes 8 s and gives a net displacement of +2 m.
Reaching the pit
The pit is 13 m from the start. The key point is that during each forward surge the drunkard climbs to a peak higher than his net position, so he can reach the pit mid-cycle.
Position at the end of each completed cycle:
| Cycles completed | Time (s) | Position (m) |
|---|---|---|
| 1 | 8 | 2 |
| 2 | 16 | 4 |
| 3 | 24 | 6 |
| 4 | 32 | 8 |
After 4 cycles he is at 8 m at t = 32 s. On the very next forward surge he steps forward one metre at a time:
8→9→10→11→12→13 m
reaching 13 m after 5 more steps (5 s):
t=32+5=37 s …
Concept: A Closed-Form Position Function for Periodic Motion
Method: Algebraic Piecewise Formula (solve directly, no cycle-by-cycle table)
Instead of building a table of the drunkard's position at the end of each completed 8-second cycle and then checking the next partial cycle by hand, this method writes a single general formula for his position during the k-th cycle's forward phase, and solves it directly for when x=13 m.
Steps
-
Characterise one cycle. Each cycle: 5 forward steps (5 m in 5 s), then 3 backward steps (3 m in 3 s) — total duration 8 s, net displacement +2 m per cycle.
-
Position at the start of cycle k (for k=0,1,2,…, cycles counted from zero), i.e. at t=8k, after k complete cycles of net +2 m each:
x(8k)=2k
- Write position during the forward phase of cycle k — for 8k≤t≤8k+5, he is walking steadily forward from x=2k:
x(t)=2k+(t−8k),8k≤t≤8k+5
(Position is increasing throughout this window, so it's the only phase where the pit — a fixed forward threshold — can be reached for the first time.)
- Find the smallest k for which this forward phase reaches x=13. The maximum x reached in cycle k's forward phase is 2k+5; we need 2k+5≥13:
k≥4
Check k=3: max reach =2(3)+5=11<13 — not far enough. So k=4 is the first cycle whose forward phase can reach the pit.
- Solve x(t)=13 within cycle k=4's forward phase, 32≤t≤37: 2(4)+(t−32)=13⇒8+t−32=13⇒t=37 …
- KEAM 2026Set eng-2026-04204 marksMCQQ.The area under the velocity-time graph of a particle is equal to its (A) acceleration (B) displacement (C) speed (D) velocity (E) angular velocity
›Reveal solutionSolution
Integrating velocity over time gives displacement, which is the area under the v-t curve.
Displacement =∫vdt, and ∫vdt is precisely the area under the velocity-time graph. …
- KEAM 2026Set pha-2026-0420F4 marksMCQQ.The velocity(v) – time (t) graph of a particle cuts the time axis, then the particle (A) has maximum displacement at that instant (B) reverses its direction of motion at that instant (C) has a constant velocity throughoutits motion (D) has maximum acceleration at that point (E) has maximum velocity at that instant
›Reveal solutionSolution
v-t graph cutting the time axis means v passes through zero and changes sign = direction reversal.
On a velocity-time graph, the value of v at any instant is the ordinate. When the curve cuts the time axis, v=0 there and changes sign (positive to negative or vice versa) as t increases through that point. A change in the sign of velocity means the particle reverses its direction of motion at that instant. (The dis …
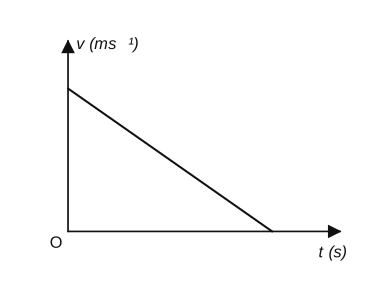
- KEAM 2025Set eng-2025-04274 marksMCQQ.For the graph shown below between time t and velocity v of the motion of a body, the correct statement is: (A) The body comes to rest at infinite time (B) At t = 0, acceleration is positive (C) At t = 0, acceleration is negative (D) At t = 0, the body has maximum velocity (E) The displacement of the particle is zero.
›Reveal solutionSolution
A straight v–t line starting high and falling to zero means velocity is greatest at t=0 (option D) and the constant negative slope means uniform deceleration; the body reaches rest at a finite time.
The graph is a straight line beginning at a positive velocity v0 at t=0 and decreasing linearly to v=0 at a finite time t1. This is uniformly decelerated motion.
- Acceleration = slope of the v–t line = constant and negative.
- Since v starts at v0 and only decreases thereafter, the velocity is a maximum at t=0. …
- KEAM 2025Set eng-2025-04294 marksMCQQ.When a body with its initial velocity non-zero, moves with constant retardation, the velocity-time graph is (A) an oblique straight line with positive slope (B) a straight line parallel to time axis (C) a straight line parallel to velocity axis (D) an oblique straight line with negative slope (E) a curve with bend upwards
›Reveal solutionSolution
Constant retardation ⇒v=u−at: a straight line with negative slope.
Kinematics. For constant retardation a (a constant deceleration), velocity varies as
v=u−at,
with u=0. This is linear in t with slope −a<0. …
- KEAM 2022Set eng-2022-P1-A14 marksMCQQ.Given below are the velocity-time graphs of five particles, A, B, C, D and E. The correct graph from the following v-t plots in which the velocity of the particle is a function of t2 is (A) [FIGURE] v-t graph A: upward-curving (concave-up, parabolic) curve rising from origin (B) [FIGURE] v-t graph B: curve rising steeply then flattening (concave-down, saturating) (C) [FIGURE] v-t graph C: straight line rising from origin (linear) (D) [FIGURE] v-t graph D: nearly flat then rising very steeply near the end (exponential-like) (E) [FIGURE] v-t graph E: rises steeply then curves down after a peak
›Reveal solutionSolution
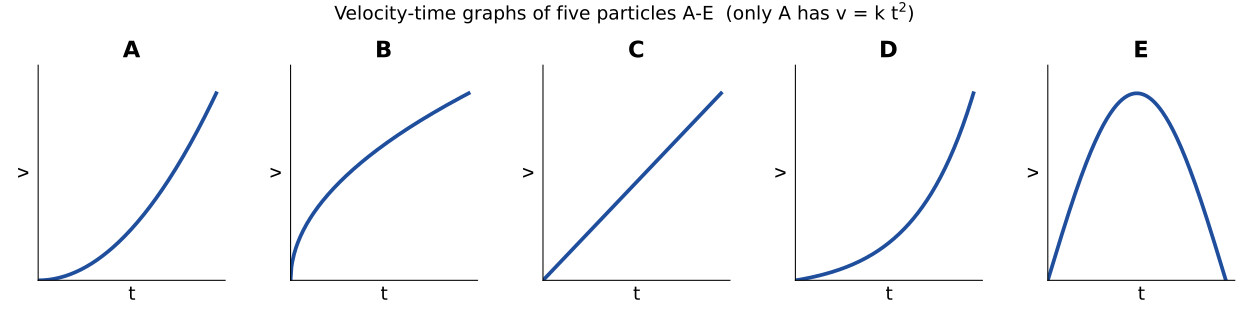
Velocity-time graphs of five particles A-E: A concave-up parabola from origin (v ∝ t^2), B concave-down saturating, C straight line, D flat-then-steep, E rise-then-fall; only A represents v ∝ t^2. [!TLDR]
v=kt2 is a concave-up parabola through the origin whose slope grows with t; that matches graph A.
Concept
The shape of a v–t graph directly reflects the functional dependence of v on t. A linear v∝t gives a straight line; a quadratic v∝t2 gives a parabola whose slope (the acceleration dv/dt=2kt) increases with time, so the curve bends upward. This graph-reading skill is standard in the NCERT/CBSE kinematics chapter that KEAM follows.
Solution
For v=kt2:
- At t=0, v=0, so the curve passes through the origin. …
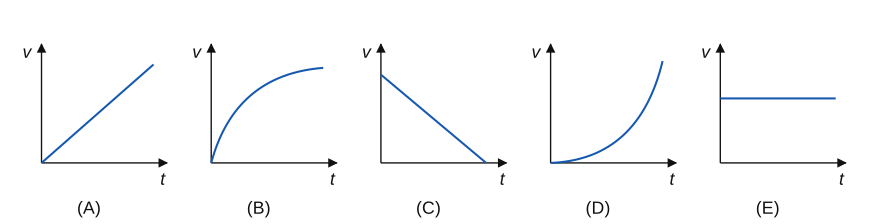
- KEAM 2021Set eng-2021-P1-A14 marksMCQQ.When a body starts from rest and moves with a constant acceleration, the velocity-time graph for its motion is (A) [FIGURE] a straight line through the origin with positive slope (B) [FIGURE] a concave-down curve rising and flattening (C) [FIGURE] a straight line with negative slope decreasing to zero (D) [FIGURE] a concave-up increasing curve (E) [FIGURE] a horizontal straight line
›Reveal solutionSolution
For rest + constant acceleration, v = at, a straight line through the origin with positive slope.
Concept and Intuition
For motion with constant acceleration a starting from rest, velocity grows linearly with time: v = u + at = 0 + at. A linear v vs t relation is a straight line, and because the initial velocity (intercept) is zero it starts at the origin; the constant, positive acceleration is its constant positive slope.
Step-by-Step Solution
- Write the kinematic equation: v = u + at with u = 0, so v = at.
- v = at is of the form y = mx (slope m = a, intercept 0) — a straight line through the origin. …
🎓Unlock everything free for 14 days
- ✓Full step-by-step solutions
- ✓Concept-first explanations
- ✓Methods, shortcuts & mistakes
- ✓PYQ mapping + timed mock tests
Full access for 14 days. No credit card required.