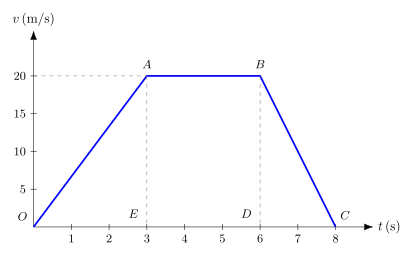
Q.A velocity-time graph is shown in the adjoining figure. [Figure: a v (m/s) versus time (s) graph with labelled points O, A, B, C, D, E; the v-axis is marked at 5, 10, 15, 20 and the t-axis is marked from 1 to 8 — the exact vertex coordinates and the line segments joining O-A-B-C-D-E did not survive text extraction, only the axis tick labels and point labels did.] Determine:
You're viewing a preview — the full solution, concept, methods & PYQ mapping are locked.
Start your 14-day free trial to unlock the full solution →Concept understanding — Velocity-Time Graph Analysis
A velocity-time (v-t) graph encodes an object's entire motion in one picture: its slope at any point gives the instantaneous acceleration at that instant, and the (signed) area enclosed between the curve and the time axis, between any two instants, gives the displacement in that interval. A horizontal segment means zero acceleration (constant velocity); a straight line with positive slope means constant positive acceleration; a straight line with negative slope means constant negative acceleration (retardation, if the object is slowing down); and a curved (nonlinear) segment means the acceleration itself is changing with time, in which case the acceleration at a chosen instant must be read off as the slope of the tangent line there rather than the slope of any chord. …
Unlock everything free for 14 days
- Full step-by-step solutions
- Concept-first explanations
- Methods, shortcuts & mistakes
- PYQ mapping + timed mock tests
Full access for 14 days. No credit card required.