Physics · Ch 10 — Thermal Properties of Matter
Change of State
Change of State
The Physics of Phase Change
When you heat a solid, its temperature rises steadily — until it reaches a certain point. Then something remarkable happens: the temperature stops rising, even though you keep adding heat. The substance begins to melt. The energy you're supplying isn't raising the temperature anymore; it's being used to break the bonds that hold the solid's structure together.
This is the central idea of change of state: a substance can exist in three common phases — solid, liquid, and gas — and the transitions between them involve energy exchanges that are not accompanied by a temperature change. These transitions are called phase changes or changes of state.
The three main changes of state are:
- Melting (solid → liquid)
- Vaporisation (liquid → gas)
- Sublimation (solid → gas, skipping the liquid phase)
The reverse processes are freezing (liquid → solid), condensation (gas → liquid), and deposition (gas → solid).
The Latent Heat Concept
Why does the temperature stay constant during a phase change? Because the heat energy you supply is doing work against the intermolecular forces — pulling molecules apart from their ordered arrangement in a solid, or freeing them entirely from the liquid surface. This energy is "hidden" in the sense that it doesn't show up as a temperature rise. It's called latent heat (from the Latin latere, meaning "to lie hidden").
Here, is the heat absorbed or released during the phase change, is the mass of the substance, and is the latent heat — the heat required to change the state of 1 kg of the substance without changing its temperature.
The unit of latent heat is .
Specific Latent Heats: Fusion and Vaporisation
The latent heat depends on which phase change we're talking about.
Latent heat of fusion () is the heat required to convert 1 kg of a solid into liquid at its melting point, without any temperature change. For water, . That's the energy needed to melt 1 kg of ice at into water at .
Latent heat of vaporisation () is the heat required to convert 1 kg of a liquid into vapour at its boiling point, without any temperature change. For water, . Notice that is much larger than — about 6.7 times larger. This makes physical sense: turning a liquid into a gas requires breaking nearly all intermolecular bonds, whereas melting only needs to loosen the rigid solid structure.
A common mistake is to think that latent heat is the same for all substances. It is not. Each substance has its own characteristic values of and , which depend on the strength of its intermolecular forces.
The Calorimetry Equation for Phase Changes
When a substance undergoes a temperature change and a phase change, you must account for both contributions. The total heat is:
where is the specific heat capacity of the substance in the phase it's in during the temperature change, and is the appropriate latent heat for the phase change.
For example, to convert ice at to steam at , you would need to:
- Heat the ice from to (using )
- Melt the ice at (using )
- Heat the water from to (using )
- Vaporise the water at (using )
- Heat the steam from to (using )
Each step contributes separately to the total heat.
The Effect of Pressure on Boiling Point
The boiling point of a liquid is not fixed — it depends on the external pressure. When you increase the pressure on a liquid, its boiling point rises. This is why a pressure cooker works: by raising the pressure inside the vessel, the water boils at a temperature higher than , cooking food faster.
Conversely, at high altitudes where atmospheric pressure is lower, water boils at a temperature below . This is why cooking takes longer in mountainous regions — the lower boiling temperature means less thermal energy is available for cooking.
The boiling point of a liquid is the temperature at which its saturated vapour pressure equals the external pressure. When the external pressure changes, the boiling point changes accordingly.
The Effect of Pressure on Melting Point
For most substances, increasing pressure raises the melting point. But water is an exception. Ice is less dense than water — its crystal structure has more open space. When you apply pressure to ice, you favour the denser liquid phase, so the melting point decreases with increasing pressure.
This is why ice skates work: the pressure under the blade lowers the melting point of ice, creating a thin film of liquid water that reduces friction. The effect is small — about per atmosphere of pressure — but it's enough.
The anomalous behaviour of water (its solid phase is less dense than its liquid phase) is responsible for this unusual pressure dependence. Most substances contract on freezing, so their solid phase is denser, and pressure raises their melting point.
The Phase Diagram …
Drawn by us to help you understand the concept clearly, and verified to make sure it's accurate. For exams, practice from your textbook's own diagram.
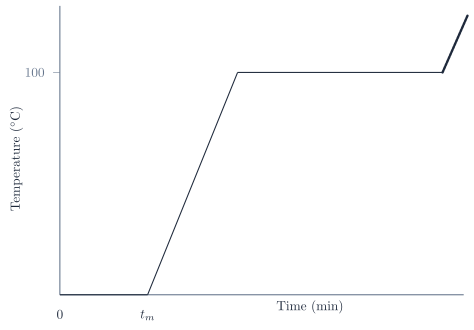
The figure plots temperature (in °C, up to 100) on the vertical axis against time on the horizontal axis. It is a heating curve for a fixed mass of ice taken initially below 0 °C. The curve is not drawn to scale — the durations of different segments are schematic, not proportional to actual times.
Starting from the left, the temperature rises steadily as the ice warms up. When it reaches 0 °C, the curve flattens into a long, low horizontal segment. This is the melting plateau: the temperature stays constant at 0 °C while the ice absorbs heat and changes phase to liquid water. The length of this flat segment corresponds to the latent heat of fusion — the energy needed to melt the ice completely without raising its temperature.
Once all the ice has melted, the temperature begins to rise again, climbing steeply from 0 °C to 100 °C. This sloping segment represents the heating of liquid water. At 100 °C, the curve flattens again into a boiling plateau. Here the temperature remains constant while the water absorbs heat and vaporises into steam. After the boiling plateau, the curve continues upward as a dashed rising segment, indicating that once all water has turned to steam, the temperature of the steam can rise further (above 100 °C).
The key physical idea is that during a phase change, the energy supplied goes into breaking intermolecular bonds rather than increasing kinetic energy, so the temperature stays constant. The heat absorbed during a phase change is given by
where is the heat absorbed, is the mass of the substance, and is the specific latent heat. For melting, is the specific latent heat of fusion (); for boiling, it is the specific latent heat of vaporisation ().
— heat absorbed during phase change (J), — mass (kg), — specific latent heat (J kg). …
Drawn by us to help you understand the concept clearly, and verified to make sure it's accurate. For exams, practice from your textbook's own diagram.
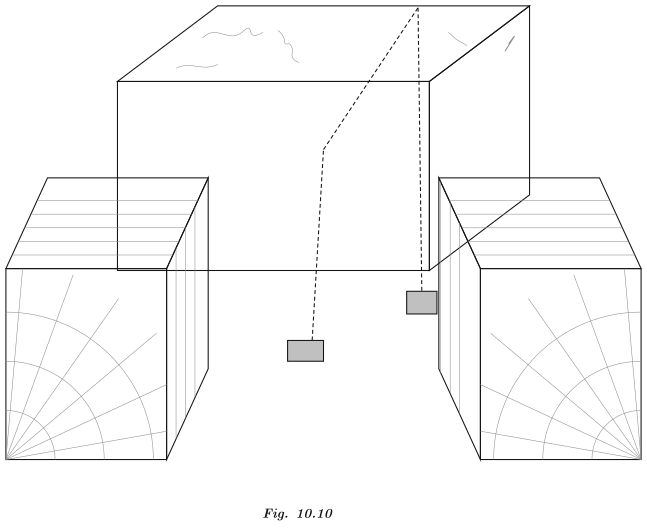
The figure shows a block of ice supported at its ends, with a thin wire resting across its top. From each end of the wire hangs a 5 kg mass. The wire, under the combined weight of the two masses, slowly cuts its way down through the ice block. Yet — and this is the striking part — the ice above the wire refreezes behind it, so the wire passes completely through the solid block without the block being cut in two. The ice remains a single, intact slab.
This demonstration is the classic illustration of regelation: the phenomenon in which ice melts under pressure and refreezes when the pressure is released. The wire exerts a large pressure on the ice directly beneath it (because the contact area is tiny). That pressure lowers the melting point of ice below , so the ice under the wire melts. The wire sinks into the resulting film of water. Once the wire has passed, the water above it is no longer under high pressure, so its melting point returns to . Since the surrounding ice is at , the water refreezes, sealing the cut.
The key physics is the Clausius–Clapeyron relation for the solid–liquid phase boundary. For a substance like water, which expands on freezing (ice is less dense than liquid water), the melting point decreases with increasing pressure. The textbook gives the formula that governs this shift:
Here:
- is the change in melting temperature (in kelvin or °C — the numerical change is the same).
- is the change in pressure applied to the solid.
- is the equilibrium melting temperature at the given pressure (in kelvin).
- is the volume per unit mass (or per mole) of the liquid phase.
- is the volume per unit mass (or per mole) of the solid phase.
- is the latent heat of fusion per unit mass (or per mole).
For ice and water at (), is negative (water is denser than ice, so liquid water occupies less volume than the same mass of ice). That minus sign makes negative: an increase in pressure lowers the melting point. The textbook uses this relation to explain why the wire can melt its way through the ice, and why the water refreezes once the pressure is removed.
A common mistake is to think the wire cuts the ice by friction or by simply sawing through it. The figure makes clear that the wire is not being pulled — it is loaded with static weights. The melting is purely a thermodynamic effect of pressure on the phase equilibrium, not a mechanical cutting action. …
Drawn by us to help you understand the concept clearly, and verified to make sure it's accurate. For exams, practice from your textbook's own diagram.
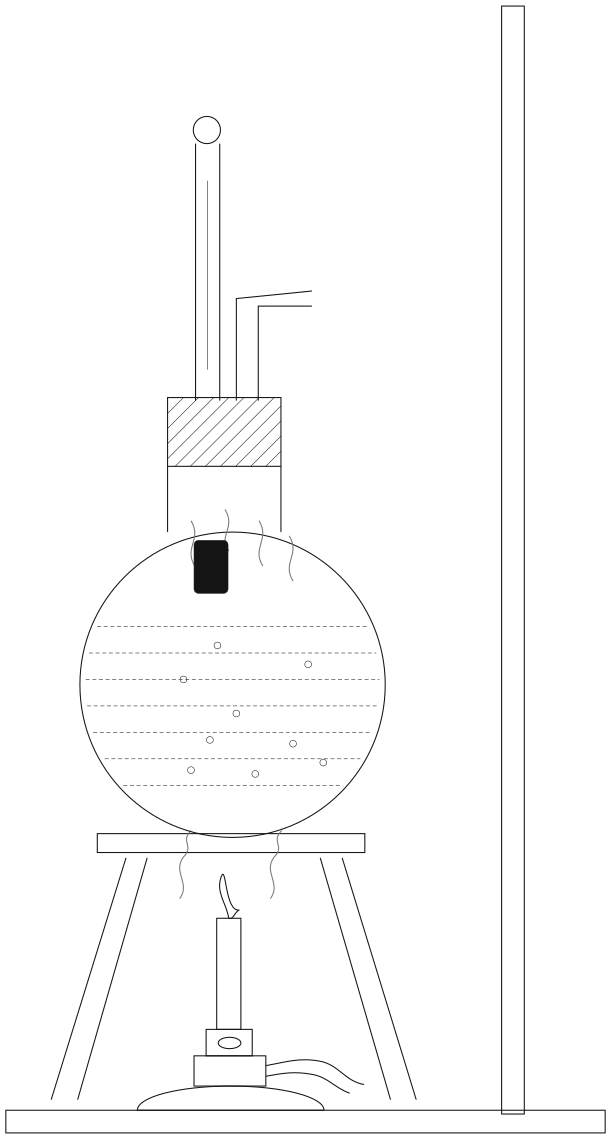
Fig. 10.11 is a simple but powerful experimental setup. A round-bottom flask, half-filled with water, sits on a wire gauze over a burner, clamped to a retort stand. A thermometer passes through a cork in the flask’s neck to measure the temperature of the water (or steam). A bent glass tube also passes through the cork; its open end acts as a steam outlet, allowing the vapour to escape into the air.
The figure is not a graph — it is a diagram of the apparatus used to study the boiling process. The key physical idea it teaches is that during boiling, the temperature of the liquid does not rise even though heat is continuously supplied. The thermometer reading stays constant at the boiling point (100 °C at standard atmospheric pressure) until all the liquid has turned into vapour. The steam outlet tube shows that the vapour is being released; if you were to collect the steam and condense it, you would find that the amount of heat absorbed per unit mass is a fixed value — the latent heat of vaporisation.
The textbook uses this figure to introduce the concept of latent heat. The heat required to convert a mass of liquid at its boiling point into vapour at the same temperature is given by
where is the latent heat of vaporisation (in J kg). For water at 1 atm, J kg. The figure makes clear that this heat does not raise the temperature — it goes entirely into overcoming the intermolecular forces that hold the liquid together, allowing the molecules to escape into the gas phase.
A common mistake is to think that the thermometer in the flask measures the temperature of the steam. In the diagram, the thermometer bulb is immersed in the liquid water, so it reads the temperature of the liquid. The steam temperature is the same only if the steam is in equilibrium with the boiling liquid — which it is, as long as the outlet is open to the atmosphere. …
Drawn by us to help you understand the concept clearly, and verified to make sure it's accurate. For exams, practice from your textbook's own diagram.
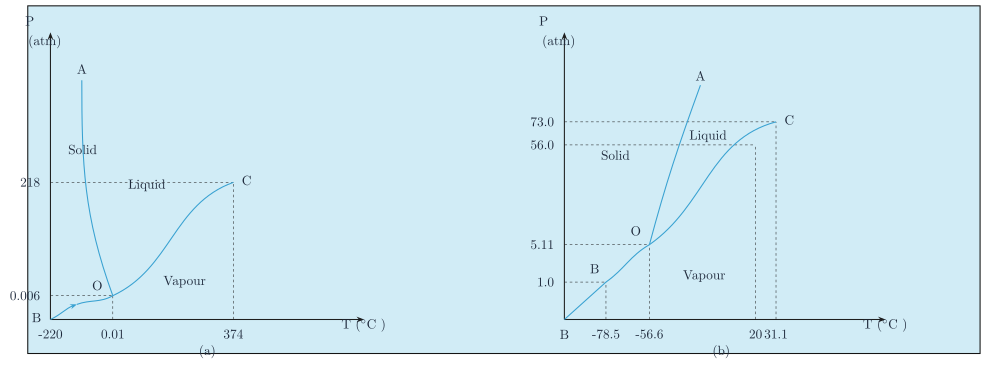
This boxed figure in the NCERT text (placed immediately after the discussion of the triple point, and left unnumbered in the original) shows two separate pressure–temperature (P-T) phase diagrams side by side, one for water and one for carbon dioxide (CO2), each not drawn to scale.
Panel (a) — Water. The horizontal axis is temperature in °C, the vertical axis is pressure. Three curves divide the plane into three regions labelled Solid, Liquid, and Vapour:
- Curve BO — the sublimation curve, along which solid ice and water vapour coexist in equilibrium, running from a point B at low temperature/low pressure up to the point O.
- Curve AO — the fusion (melting) curve, along which solid ice and liquid water coexist in equilibrium, running from a point A at higher pressure down to O. This curve leans slightly backward (a small negative slope) as pressure increases — a feature unique to water among common substances, reflecting the fact that ice is less dense than liquid water.
- Curve OC — the vaporisation curve, along which liquid water and water vapour coexist in equilibrium, running from O up toward a point C.
The point O, where all three curves meet, is the triple point of water: , (). The vaporisation curve OC continues up to the critical point, beyond which liquid and vapour become indistinguishable, near . The temperature axis spans roughly from about (deep in the solid/sublimation region), through the fixed points at and (the normal boiling point, where the vaporisation curve crosses 1 atm), up to the critical temperature near ; the pressure axis spans from well below past 1 atm up to the higher pressures near the critical point.
Panel (b) — Carbon dioxide (CO2). The same three regions and three curves (sublimation, fusion, vaporisation) appear, but CO2's triple point O is at , — a much higher pressure than water's triple point. The axis values marked are approximately (the sublimation temperature at 1 atm — this is why solid CO2, "dry ice," sublimes directly to gas at ordinary atmospheric pressure without ever forming a liquid), (the triple-point temperature), and , up to the critical temperature near ; pressures marked are approximately , (the triple-point pressure), (the pressure at which CO2 is liquid at room temperature), and the critical pressure near . Unlike water, CO2's fusion curve AO has the normal (positive) slope — melting point rises with pressure — because solid CO2 is denser than liquid CO2, the behaviour of most substances.
Along any one of the three curves, two phases coexist together in thermal and mechanical equilibrium — every point on a curve is a valid (pressure, temperature) pair at which both phases can be present simultaneously, in any proportion. The single point where all three curves meet — the triple point — is the only combination of pressure and temperature at which the solid, liquid, and vapour phases of the substance can all coexist together at once. …