Economics · Ch 3 — Money and Banking
Policy Tools to Control Money Supply
Policy Tools to Control Money Supply
3.4 Policy Tools to Control Money Supply
The Reserve Bank of India is the sole institution authorised to issue currency in the country. When commercial banks need additional funds to expand their lending and create more credit, they can either borrow from the money market or approach the central bank. The RBI provides funds to banks through various instruments, and this function — being ready to lend to banks at all times — is what makes the central bank the lender of last resort.
The RBI controls the money supply in the economy using two broad categories of tools: quantitative tools and qualitative tools.
Quantitative Tools
Quantitative tools affect the overall volume of money supply by changing key parameters. The three main quantitative instruments are:
1. Cash Reserve Ratio (CRR)
The CRR is the fraction of total deposits that commercial banks must keep as reserves with the central bank. When the RBI increases the CRR, banks are required to hold a larger portion of their deposits as reserves, leaving less money available for lending. This reduces the credit creation capacity of banks and contracts the money supply. Conversely, a decrease in the CRR frees up reserves, allowing banks to lend more and expand the money supply.
Consider the earlier example from the chapter. With a reserve ratio of 20%, Rs 100 in reserves could support deposits of Rs 400. If the RBI raises the reserve ratio to 25%, the same Rs 100 in reserves can now support only Rs 400 × (20/25) = Rs 320 in deposits. The banking system would be able to loan only Rs 300 instead of Rs 320. To meet the increased reserve requirement, banks would have to call back some loans, and the money supply would fall.
A higher reserve ratio reduces the money multiplier and contracts the money supply.
2. Bank Rate
The bank rate is the rate at which the RBI lends to commercial banks. By changing this rate, the central bank influences the cost of borrowing for banks. When the RBI increases the bank rate, loans taken by commercial banks become more expensive. This discourages banks from borrowing from the central bank, reduces their reserves, and consequently decreases the money supply. A fall in the bank rate has the opposite effect — it makes borrowing cheaper, increases reserves, and expands the money supply.
3. Open Market Operations (OMO)
Open market operations refer to the buying and selling of government bonds in the open market. This function is entrusted to the central bank on behalf of the government.
When the RBI buys a government bond in the open market, it pays for it by issuing a cheque. This cheque increases the total amount of reserves in the banking system, which in turn increases the money supply through the multiplier process. When the RBI sells a bond to private individuals or institutions, the payment received reduces the quantity of reserves in the system, contracting the money supply.
There are two types of open market operations:
Outright OMO: These are permanent in nature. When the central bank buys securities, it does so without any promise to sell them later. Similarly, when it sells securities, it does so without any promise to buy them back. The injection or absorption of money is therefore permanent.
Repo Operations: In a repurchase agreement (repo), the central bank buys a security with a simultaneous agreement to sell it back at a specified date and price. The interest rate at which money is lent in this way is called the repo rate. In a reverse repurchase agreement (reverse repo), the central bank sells securities with an agreement to repurchase them at a specified date and price. The rate at which money is withdrawn in this manner is called the reverse repo rate.
The Reserve Bank of India conducts repo and reverse repo operations at various maturities — overnight, 7-day, 14-day, and so on. These operations have now become the main tool of monetary policy for the RBI.
Repo and reverse repo operations are now the primary instruments of monetary policy in India, having largely replaced the bank rate and CRR as the main tools for day-to-day liquidity management.
Qualitative Tools
Qualitative tools are used to influence the direction and composition of credit rather than its total volume. The main qualitative tools are:
Moral Suasion: The central bank persuades commercial banks through discussions, letters, or directives to encourage or discourage lending in specific sectors. This is a form of informal pressure rather than a legal requirement.
Margin Requirements: The central bank can change the margin requirements for loans — the difference between the market value of collateral and the loan amount. Higher margin requirements reduce the amount of credit available against a given collateral, while lower margins increase it.
The Money Multiplier and Reserve Ratio
The relationship between the reserve ratio and the money supply is central to understanding how quantitative tools work. If the RBI increases the reserve ratio, the money multiplier falls, and the same amount of reserves supports a smaller volume of deposits. This reduces the lending capacity of banks and contracts the money supply. A decrease in the reserve ratio has the opposite effect.
A common mistake is to think that changing the CRR only affects the amount of reserves banks must hold. In reality, because of the money multiplier, a small change in the CRR can have a large effect on the total money supply. This is why the RBI uses the CRR cautiously.
Box 3.1 · Demand and Supply for Money: A Detailed Discussion
Money is the most liquid of all assets: it is universally acceptable and can be exchanged for other goods with ease. Holding it, though, carries an opportunity cost — cash in hand earns nothing, whereas the same sum placed in a fixed deposit would earn interest. Deciding how much money to hold therefore means weighing the convenience of liquidity against the interest given up, and it is this trade-off that leads us to call the demand for money liquidity preference.
People hold money balances for two broad reasons — a transaction motive and a speculative motive — each examined in turn below.
The Transaction Motive
The principal motive for holding money is to carry out transactions. If your income receipts and expenditure patterns were perfectly synchronised, you would not need to hold any cash balance. But in reality, people earn incomes at discrete points in time and spend it continuously throughout the interval.
Suppose you earn Rs 100 on the first day of every month and run down this balance evenly over the rest of the month. Your cash balance at the beginning of the month is Rs 100 and at the end is Rs 0. Your average cash holding is (Rs 100 + Rs 0) ÷ 2 = Rs 50, with which you are making transactions worth Rs 100 per month. Your average transaction demand for money is therefore equal to half your monthly income, or half the value of your monthly transactions.
Consider a two-person economy consisting of a firm (owned by one person) and a worker. The firm pays the worker a salary of Rs 100 at the beginning of every month. The worker spends this income over the month on the output produced by the firm — the only good available in this economy. At the beginning of each month, the worker has a money balance of Rs 100 and the firm has Rs 0. On the last day of the month, the picture is reversed — the firm has gathered Rs 100 through its sales to the worker. The average money holding of the firm and the worker is Rs 50 each. The total transaction demand for money in this economy is Rs 100. The total volume of monthly transactions is Rs 200 — the firm has sold output worth Rs 100 to the worker, and the worker has sold her services worth Rs 100 to the firm.
The transaction demand for money in an economy is a fraction of the total volume of transactions over a unit period of time. In general:
where is the transaction demand for money, is the total value of (nominal) transactions in the economy over a unit period, and is a positive fraction.
In the two-person economy, the economy uses money balance worth only Rs 100 for making transactions worth Rs 200 per month. Each rupee is changing hands twice a month. On the first day, it is transferred from the employer's pocket to that of the worker, and sometime during the month, it passes from the worker's hand to the employer's. The number of times a unit of money changes hands during the unit period is called the velocity of circulation of money. In this example, it is 2 — the inverse of half, which is the ratio of money balance to the value of transactions.
where is the velocity of circulation. is a flow variable, while is a stock variable — the stock of money people are willing to hold at a particular point in time. The left-hand side measures the total value of monetary transactions made with this stock in the unit period of time, which is a flow variable equal to .
We are ultimately interested in the relationship between the aggregate transaction demand for money and the nominal GDP. The total value of annual transactions includes transactions in all intermediate goods and services and is much greater than nominal GDP. However, there is normally a stable, positive relationship between the value of transactions and nominal GDP. An increase in nominal GDP implies an increase in the total value of transactions and hence a greater transaction demand for money.
where is real GDP and is the general price level (GDP deflator). This equation tells us that transaction demand for money is positively related to the real income of an economy and also to its average price level.
The Speculative Motive
An individual may hold wealth in the form of landed property, bullion, bonds, money, and so on. For simplicity, let us group all forms of assets other than money into a single category called "bonds." Bonds are papers bearing the promise of a future stream of monetary returns over a certain period of time. They are issued by governments or firms for borrowing money from the public and are tradable in the market.
Consider a two-period bond. A firm wishes to raise a loan of Rs 100 from the public. It issues a bond that assures Rs 10 at the end of the first year and Rs 10 plus the principal of Rs 100 at the end of the second year. Such a bond has a face value of Rs 100, a maturity period of two years, and a coupon rate of 10 per cent.
Assume the rate of interest prevailing in your savings bank account is 5 per cent. To compare the earning from this bond with the interest earning of your savings bank account, you ask: How much money, if kept in my savings bank account, will generate Rs 10 at the end of one year? Let this amount be .
This amount, Rs , is called the present value of Rs 10 discounted at the market rate of interest. Similarly, let be the amount of money which, if kept in the savings bank account, will generate Rs 110 at the end of two years.
The present value of the stream of returns from the bond is:
Calculation reveals that this is approximately Rs 109.29. This means that if you put Rs 109.29 in your savings bank account, it will fetch the same return as the bond. But the seller of the bond is offering it at a face value of only Rs 100. Clearly the bond is more attractive than the savings bank account, and people will rush to get hold of it. Competitive bidding will raise the price of the bond above its face value until the price equals its PV. If the price rises above the PV, the bond becomes less attractive compared to the savings bank account, and people would like to get rid of it. The bond will be in excess supply, and there will be downward pressure on the bond price, bringing it back to the PV.
Under competitive asset market conditions, the price of a bond must always equal its present value in equilibrium.
Now consider an increase in the market rate of interest from 5 per cent to 6 per cent. The present value, and hence the price of the same bond, becomes:
It follows that the price of a bond is inversely related to the market rate of interest.
Different people have different expectations regarding future movements in the market rate of interest, based on their private information about the economy. If you think the market rate of interest should eventually settle at 8 per cent per annum, you may consider the current rate of 5 per cent too low to be sustainable. You expect interest rates to rise and consequently bond prices to fall. If you are a bond holder, a decrease in bond price means a loss to you — similar to a loss you would suffer if the value of a property you held suddenly depreciated. Such a loss from a falling bond price is called a capital loss to the bond holder. Under such circumstances, you will try to sell your bond and hold money instead.
Thus, speculations regarding future movements in interest rates and bond prices give rise to the speculative demand for money.
When the interest rate is very high, everyone expects it to fall in future and hence anticipates capital gains from bond-holding. People convert their money into bonds, so speculative demand for money is low. When the interest rate comes down, more and more people expect it to rise in the future and anticipate capital loss. They convert their bonds into money, giving rise to a high speculative demand for money. Hence, speculative demand for money is inversely related to the rate of interest.
where is the market rate of interest, and and are the upper and lower limits of , both positive constants. As decreases from to , the value of increases from 0 to .
Interest rate can be thought of as the opportunity cost or "price" of holding money balance. If the supply of money in the economy increases and people purchase bonds with this extra money, demand for bonds goes up, bond prices rise, and the rate of interest declines. In other words, with an increased supply of money, the price you have to pay for holding money balance — the rate of interest — should come down.
However, if the market rate of interest is already low enough that everybody expects it to rise in future, causing capital losses, nobody will wish to hold bonds. Everyone in the economy will hold their wealth in money balance. If additional money is injected into the economy, it will be used up to satiate people's craving for money balances without increasing the demand for bonds and without further lowering the rate of interest below the floor . Such a situation is called a liquidity trap. The speculative money demand function is infinitely elastic here.
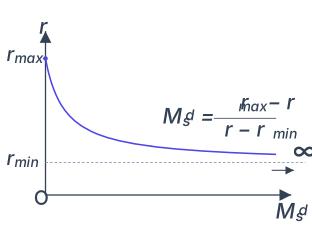
Drawn by us to help you understand the concept clearly, and verified to make sure it's accurate. For exams, practice from your NCERT textbook's own diagram.
The figure plots the rate of interest () on the vertical axis and speculative demand for money () on the horizontal axis. The origin is marked O. A single downward-sloping convex curve runs from the vertical axis down to the right. The curve begins at a point on the vertical axis labelled — at this interest rate, speculative demand is zero. As falls, the curve drops steeply at first, then gradually flattens out. It approaches a horizontal dashed line drawn at , the floor rate of interest. Near , the curve tends to infinity: an infinity sign () and a short rightward arrow along the line mark this. The curve itself is labelled with its equation: .
What this teaches is the speculative motive for holding money. People hold money not just for transactions but as an asset — a store of value. When interest rates are high (near ), the opportunity cost of holding money is large: you lose the interest you could earn by putting that money in a bank deposit or bond. So speculative demand is zero. As rates fall, holding money becomes cheaper, and demand rises. The curve is convex because the relationship is non-linear: at moderate rates, a small drop in causes a large jump in demand; at very low rates, even a tiny further drop causes an enormous increase. …
The figure plots the speculative demand for money on the horizontal axis and the rate of interest on the vertical axis. When , speculative demand for money is zero — the rate of interest is so high that everyone expects it to fall in future and is sure about a future capital gain, so everyone has converted speculative money balances into bonds. When , the economy is in the liquidity trap — everyone is sure of a future rise in interest rate and a fall in bond prices, so everyone puts whatever wealth they acquire in the form of money, and the speculative demand for money is infinite.
Total Demand for Money
Total demand for money in an economy is composed of transaction demand and speculative demand. The former is directly proportional to real GDP and price level, while the latter is inversely related to the market rate of interest.
The Supply of Money: Various Measures
In a modern economy, money consists mainly of currency notes and coins issued by the monetary authority of the country. In India, currency notes are issued by the Reserve Bank of India, while coins are issued by the Government of India. Apart from currency notes and coins, the balances in savings or current account deposits held by the public in commercial banks are also considered money, since cheques drawn on these accounts are used to settle transactions. Such deposits are called demand deposits because they are payable by the bank on demand from the account-holder. Other deposits, such as fixed deposits, have a fixed period to maturity and are referred to as time deposits.
Though a hundred-rupee note can be used to obtain commodities worth Rs 100 from a shop, the value of the paper itself is negligible. Similarly, the value of the metal in a five-rupee coin is probably not worth Rs 5. Why then do people accept such notes and coins in exchange for goods that are apparently more valuable? The value of currency notes and coins is derived from the guarantee provided by the issuing authority. Every currency note bears a promise from the Governor of RBI that if someone produces the note to the RBI or any commercial bank, the RBI will be responsible for giving the person purchasing power equal to the value printed on the note. The same is true of coins. …