Q.The following diagram represents
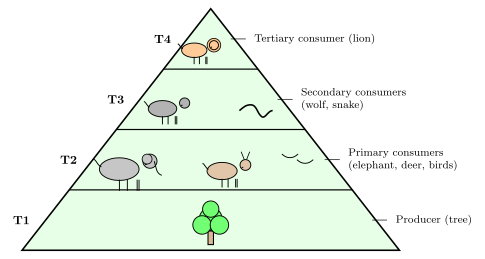
[A pyramid diagram with four labelled trophic levels T1, T2, T3, T4, printed in the source without the shape/outline of the pyramid itself being recoverable from the extracted text — only the level labels survive.]
You're viewing a preview — the full solution, concept, methods & PYQ mapping are locked.
Start your 14-day free trial to unlock the full solution →Step 1. Read the trophic levels from the figure. T1 (base) shows a single tree — the producer. T2 shows several herbivore species together (elephant, small birds, deer) — the primary consumers. T3 shows fewer organisms, a wolf and a snake — the secondary consumers (carnivores that feed on herbivores). T4 (apex) shows just one organism, a lion — the tertiary consumer / top carnivore.
Step 2. Note the overall shape. The pyramid is upright: broad at the base and narrowing steadily toward the apex, meaning the NUMBER of individual organisms falls sharply at each successive trophic level. This is what a pyramid of NUMBER depicts (a count of organisms per trophic level), not a pyramid of biomass (which plots total mass) or of energy.
Step 3. Match the organisms to a habitat/ecosystem type. Every organism shown — tree, elephant, deer, birds, wolf, snake, lion — is terrestrial, consistent with an open grassland/savanna food chain (grass/tree → grazing herbivores → carnivores → top carnivore). None of them are aquatic organisms such as phytoplankton, zooplankton or fish, so a pond ecosystem is ruled out. …
Unlock everything free for 14 days
- Full step-by-step solutions
- Concept-first explanations
- Methods, shortcuts & mistakes
- PYQ mapping + timed mock tests
Full access for 14 days. No credit card required.