Mathematics · Ch 7 — Applications of Differential Calculus
Related Rates
Related Rates
A related-rates problem involves at least two quantities that are changing with time and are linked to each other through some equation; knowing the rate at which some of the quantities change lets you find the rate at which another one changes.
Standard workflow.
- Write down the equation relating the quantities (a geometric formula — area, volume, Pythagorean relation, similar triangles, …).
- Differentiate both sides with respect to time , applying the chain rule to every quantity that is itself a function of (this is the step that actually introduces the rates into the equation).
- Substitute the values that are known at the instant in question (including any value of the quantity itself, found if necessary from the original constraint equation).
- Solve algebraically for the required rate.
Worked patterns from the textbook examples, all reused in Exercise 7.1:
- Sphere/circle growth: ; .
- Price vs. supply: differentiate the given price–supply relation with respect to time, then substitute the known and .
- Conical pile (fixed height-to-radius ratio): use the given ratio to write in terms of a single variable before differentiating.
- Two-variable related rate (two moving objects): set up a Pythagorean (or similar) relation between the two independently-moving legs and the connecting distance, differentiate implicitly with respect to , then substitute the given instantaneous positions and rates. …

Drawn by us to help you understand the concept clearly, and verified to make sure it's accurate. For exams, practice from your textbook's own diagram.
What this figure shows. A spherical balloon of radius r with its equatorial great circle shown as an ellipse and a radius arrow, labelled with the volume V = …

Drawn by us to help you understand the concept clearly, and verified to make sure it's accurate. For exams, practice from your textbook's own diagram.
What this figure shows. A conical pile of salt with circular base shown as an ellipse, a vertical height arrow h from the base centre to the apex, and a radius arrow r …
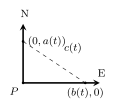
Drawn by us to help you understand the concept clearly, and verified to make sure it's accurate. For exams, practice from your textbook's own diagram.
What this figure shows. Two cars leaving an intersection P: one travelling north to (0, a(t)) and one travelling east to (b(t), 0), with the dashed hypotenuse c(t) giving the dista …