Economics · Ch 8 — Theory of Consumer Behaviour
Market Demand
Market Demand
Market Demand
The demand curve we studied in the previous section belonged to a single consumer. But in the real world, markets consist of many consumers. The market demand for a good is the sum of the quantities demanded by all individual consumers at each possible price, during a given period of time.
Deriving Market Demand from Individual Demands
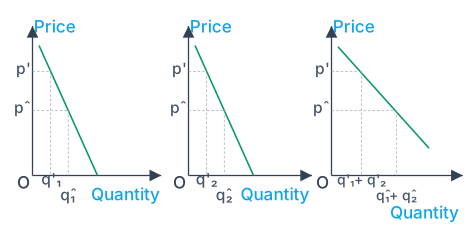
Suppose there are only two consumers in the market for a good — Consumer 1 and Consumer 2. Their individual demand curves are shown in panels (a) and (b) of Figure 2.18. At price , Consumer 1 demands units and Consumer 2 demands units. The market demand at price is simply .
If we repeat this addition for every possible price, we get the market demand curve shown in panel (c).
Drawn by us to help you understand the concept clearly, and verified to make sure it's accurate. For exams, practice from your NCERT textbook's own diagram.
The figure is laid out as three side-by-side panels, each with price on the vertical axis and quantity on the horizontal axis. The first two panels are labelled for Consumer 1 and Consumer 2 respectively. In each of these, a single downward-sloping demand curve is drawn — relatively steep, indicating that each individual’s quantity demanded is not very responsive to price changes. Two specific price levels are marked with dashed horizontal lines: a higher price labelled and a lower price labelled .
At price , Consumer 1’s demand is and Consumer 2’s demand is . At the lower price , Consumer 1’s demand rises to and Consumer 2’s demand rises to . These individual quantities are read off where each dashed price line meets the respective demand curve.
The third panel shows the market demand curve. This curve is noticeably flatter than either individual curve, meaning that total market quantity is more responsive to price changes. The key construction is that at each price, the market quantity is the sum of the two individual quantities. So at price , the market quantity is ; at price , it is . These two summed points are plotted in the third panel, and the market demand curve is drawn through them.
The dashed horizontal lines at and are common across all three panels — they serve as the reference prices at which the horizontal addition is performed. …
This curve is the horizontal summation of the individual demand curves. At any given price, we read off the quantity demanded by each consumer from their respective demand curves, add them, and plot that total quantity against the same price.
Horizontal summation means adding quantities at the same price — not adding prices at the same quantity. This is a common point of confusion.
The Market Demand Schedule and Curve
Consider a numerical example. Suppose Consumer 1's demand function is and Consumer 2's demand function is , for prices between ₹0 and ₹20. The market demand function is:
This holds for prices where both consumers demand non-negative quantities. For prices above ₹10, Consumer 2's demand becomes zero (since ), so the market demand equals Consumer 1's demand alone. For prices above ₹20, both consumers demand zero.
The market demand schedule can be shown as:
| Price (₹) | Consumer 1's Demand | Consumer 2's Demand | Market Demand |
|---|---|---|---|
| 0 | 20 | 30 | 50 |
| 5 | 15 | 20 | 35 |
| 10 | 10 | 10 | 20 |
| 15 | 5 | 0 | 5 |
| 20 | 0 | 0 | 0 |
The market demand curve slopes downward from left to right, just like an individual demand curve. This is because each individual demand curve slopes downward, and adding them preserves that property.
Shifts in the Market Demand Curve
The market demand curve is drawn assuming that all factors other than the good's own price remain constant. When any of these other factors change, the entire market demand curve shifts.
A rightward shift of the market demand curve means that at every price, consumers collectively demand a larger quantity than before. A leftward shift means they demand a smaller quantity at every price.
What causes these shifts? Several factors:
Change in consumers' income. If the incomes of most consumers rise, their demand for a normal good increases at each price — the market demand curve shifts to the right. For an inferior good, rising incomes would shift the curve to the left.
Change in the price of related goods. If the price of a substitute good (like tea for coffee) rises, consumers switch to the good in question, increasing its demand at every price — a rightward shift. If the price of a complement good (like sugar for tea) rises, demand for the good falls — a leftward shift.
Change in tastes and preferences. Fads, advertising, seasons, or new information can change what people want. A favourable change in tastes shifts the demand curve rightward; an unfavourable change shifts it leftward.
Change in the number of consumers. This factor is unique to market demand — it does not affect an individual's demand curve. If the population grows or new consumers enter the market, the market demand curve shifts rightward. If consumers leave the market, it shifts leftward.
Change in expectations about future prices. If consumers expect the price to rise in the future, they may buy more now, shifting the current demand curve rightward. If they expect a price drop, they may postpone purchases, shifting it leftward. …