Economics · Ch 8 — Theory of Consumer Behaviour
Movements along the Demand Curve and Shifts in the Demand Curve
Movements along the Demand Curve and Shifts in the Demand Curve
Movements Along the Demand Curve
The demand curve is drawn under the ceteris paribus condition — everything except the good's own price is held fixed. When the price of the good itself changes, the consumer moves to a different point on the same demand curve. This is called a movement along the demand curve.
For example, suppose the price of a good falls from ₹10 to ₹8. At the original price, the consumer bought 5 units (point A on the curve). At the lower price, she buys 7 units (point B). The movement from A to B is along the curve — the curve itself has not changed. The only thing that has changed is the quantity demanded, caused by a change in the good's own price.
A movement along the demand curve is not a change in demand. It is a change in quantity demanded due to a price change. The demand curve itself remains exactly where it was.
Shifts in the Demand Curve
When any factor other than the good's own price changes, the entire demand curve shifts to a new position. This is called a shift in the demand curve. The factors that cause a shift are:
- Income of the consumer: For a normal good, an increase in income shifts the demand curve to the right (more demanded at every price). For an inferior good, an increase in income shifts it to the left.
- Prices of other goods: If a substitute good becomes cheaper, demand for the original good falls (curve shifts left). If a complement becomes cheaper, demand for the original good rises (curve shifts right).
- Tastes and preferences: A favourable change in tastes (e.g., a new health study praising the good) shifts the curve rightward. An unfavourable change shifts it leftward.
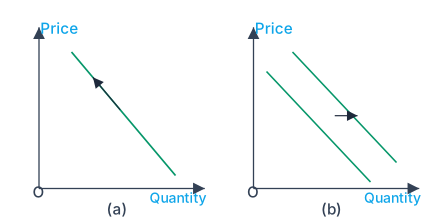
Panel (a) of Figure 2.17 shows a leftward shift — at every price, the consumer now demands less than before. Panel (b) shows a rightward shift — at every price, she demands more.
Drawn by us to help you understand the concept clearly, and verified to make sure it's accurate. For exams, practice from your NCERT textbook's own diagram.
Figure 2.17 has two panels, each with price on the vertical axis and quantity on the horizontal axis.
Panel (a) shows a single downward-sloping demand curve. An arrow runs along the curve itself, pointing up and to the left. This arrow indicates a movement along the demand curve — from a point of lower price and higher quantity to a point of higher price and lower quantity (or vice versa). The only thing that changes here is the good’s own price. All other factors (income, prices of other goods, tastes) are held constant, so the curve itself does not move.
Panel (b) shows two parallel demand curves. One is to the left, the other to the right. An arrow points from the left curve to the right curve, indicating a shift of the entire demand curve to the right. This happens when something other than the good’s own price changes — for example, an increase in income (for a normal good), a rise in the price of a substitute, or a favourable change in tastes. At every price, the quantity demanded is now higher than before. A leftward shift (not shown in this panel but mentioned in the text) would occur when those other factors change in the opposite direction. …
A shift in the demand curve means that at the same price, the consumer now buys a different quantity. This is fundamentally different from a movement along the curve, where the price itself is the cause.
Market Demand
So far we have considered a single consumer. In reality, a market has many consumers. The market demand for a good at a given price is the sum of the quantities demanded by all consumers at that price.
If there are only two consumers in the market, and at price consumer 1 demands units and consumer 2 demands units, then the market demand at is:
Similarly, at price , if consumer 1 demands and consumer 2 demands , the market demand is .
This logic extends to any number of consumers. The market demand curve is obtained by horizontally summing the individual demand curves — that is, adding the quantities demanded by each consumer at each price.
Horizontal summation means you take the same price on the vertical axis, read off the quantity demanded by each consumer, and add those quantities. You then plot the total quantity at that price. Repeat for every price.
Worked Example: Adding Two Linear Demand Curves
Consider a market with exactly two consumers. Their individual demand curves are:
These are linear functions. However, note the domain restrictions: consumer 1 demands zero units at any price greater than 10 (because becomes negative, and negative demand is meaningless). Similarly, consumer 2 demands zero at any price greater than 15.
To derive the market demand, we add the two functions piecewise, respecting these cutoffs.
Case 1: Price 10
Both consumers demand positive quantities. So:
Case 2:
Consumer 1 demands zero. Only consumer 2 is active. So:
Case 3:
Both consumers demand zero. So:
The market demand curve therefore has a kink at and another at . It is not a single straight line — it is a piecewise linear curve.
When adding demand curves, always check the price at which each consumer stops buying (the choke price). The market demand curve will have a kink at each such price.