Skip to content

Mathematics · Ch 4 — Inverse Trigonometric Functions

Graph of the Cosecant Function

4.6.1

Graph of the Cosecant Function

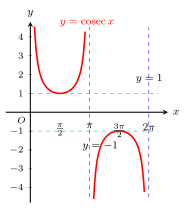
On (0,2π)(0,2\pi), cosecant is continuous everywhere EXCEPT at x=πx=\pi (where sin⁡π=0\sin\pi=0), and it has neither a maximum nor a minimum. Its behaviour, piece by piece: falls from +∞+\infty down to 11 as xx runs over (0,π2]\left(0,\tfrac{\pi}2\right]; rises from 11 back up to +∞+\infty as xx runs over [π2,π)\left[\tfrac{\pi}2,\pi\right); then, on the other side of the asymptote at π\pi, rises from −∞-\infty up to −1-1 as xx runs over (π,3π2]\left(\pi,\tfrac{3\pi}2\right]; and falls from −1-1 back down to −∞-\infty as xx runs over [3π2,2π)\left[\tfrac{3\pi}2,2\pi\right). …

Figure 4.19Graph of y = cosec x on (0, 2pi) excluding pi: an upward branch over (0, pi) with minimum 1 at pi/2 and a downward branch over (pi, 2pi) with maximum -1 at 3pi/2; vertical asymptote at x = pi.
Fig. 4.19 — Graph of y = cosec x on (0, 2pi) excluding pi: an upward branch over (0, pi) with minimum 1 at pi/2 and a downward branch over (pi, 2pi) with maximum -1 at 3pi/2; vertical asymptote at x = pi.

Drawn by us to help you understand the concept clearly, and verified to make sure it's accurate. For exams, practice from your textbook's own diagram.

What this figure shows. A U-shaped branch above y=1y=1 on (0,π)(0,\pi) and an inverted U-shaped branch below y=−1y=-1 on (π,2π)(\pi,2\pi), each branch shooting off to ±∞\pm\infty near its asymptotes at x=0,π,2πx=0,\pi,2\pi. …

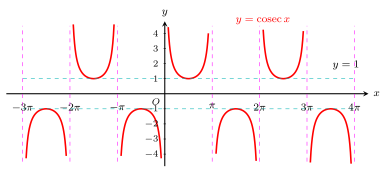
Figure 4.20Graph of y = cosec x over its entire domain: repeated upward branches (minimum 1) over intervals where sin x > 0 and downward branches (maximum -1) where sin x < 0; vertical asymptotes at x = n*pi.
Fig. 4.20 — Graph of y = cosec x over its entire domain: repeated upward branches (minimum 1) over intervals where sin x > 0 and downward branches (maximum -1) where sin x < 0; vertical asymptotes at x = n*pi.

Drawn by us to help you understand the concept clearly, and verified to make sure it's accurate. For exams, practice from your textbook's own diagram.

What this figure shows. The Fig. 4.19 pair of U-shaped branches repeated at every interval of length 2π2\pi, with vertical asymptotes at every integer multiple of π\pi. …