Economics · Ch 6 — Non-Competitive Markets
Total, Average and Marginal Revenues
Total, Average and Marginal Revenues
A closer look at Table 6.1 shows that does not rise by the same amount for every extra unit. The first unit raises from 0 to Rs 9.50 (a rise of Rs 9.50); the 5th unit raises it by only Rs 5.50 (Rs 37.50 − Rs 32). After 10 units starts to fall, so the 12th unit changes by , a fall of Rs 1.50.
This change in total revenue from selling one more unit is the marginal revenue (), shown in the last column of Table 6.1. The at any quantity is the difference between the at that quantity and the at the previous quantity — for example, at , . Formally,
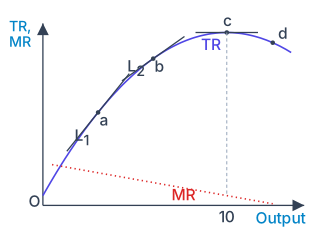
As quantity rises, falls; once quantity passes 10 units, becomes negative. In Fig. 6.2 the is drawn as the dotted line that cuts the horizontal axis at .
Graphically, the value of is given by the slope of the tangent to the TR curve at that output (Fig. 6.4). At point 'a' the tangent is steep and positive; at point 'b' the tangent is flatter (smaller positive slope); at the peak (10 units) the tangent is horizontal, so ; and on the falling arm (point 'd') the tangent is negatively sloped, so . We conclude that when total revenue is rising, marginal revenue is positive, and when total revenue falls, marginal revenue is negative.
Drawn by us to help you understand the concept clearly, and verified to make sure it's accurate. For exams, practice from your textbook's own diagram.
Marginal revenue at any output is the slope of the tangent to the total revenue curve. The tangent at a is steep, at b is flatter, at the peak c (10 units) it is horizontal so , and past the peak …
Why is not exactly zero at in Table 6.1? Because the table measures discretely, by jumping from 9 units to 10 units. If is recomputed for values of closer to 10 — say 9.5, 9.75 or 9.9 — gets closer to 50 (for instance, at , ), and the marginal revenue approaches zero.
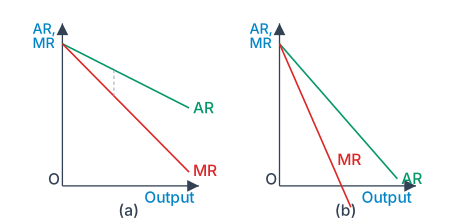
Relation between the AR and MR curves …
Drawn by us to help you understand the concept clearly, and verified to make sure it's accurate. For exams, practice from your textbook's own diagram.
How far the MR curve lies below the AR curve depends on the steepness of demand. Panel (a) shows a flatter AR with MR close below it; panel (b) shows a stee …