Informatics Practices · Ch 7 — Project Based Learning
Project IV: Utilising an open data source to use a national, state or district level Dataset
Project IV: Utilising an open data source to use a national, state or district level Dataset
Understanding the Project
This project is about learning to work with a real, large-scale government dataset. The goal is not just to write code, but to understand how to ask meaningful questions of data and answer them step by step. You will use the Open Government Data (OGD) Platform India, specifically the website www.data.gov.in, which is the official platform for sharing data under the Government of India's open data initiative.
The dataset you will use is called "Special Tabulation on Adolescent and youth population classified by various parameters for India, States and Union Territories, 2011". It was contributed by the Ministry of Home Affairs and released under the National Data Sharing and Accessibility Policy (NDSAP) on 07/09/2015. This is a massive dataset with 12,168 rows and 123 columns, so you will learn how to filter and summarise it efficiently.
Understanding the Dataset Columns
The dataset contains a wealth of information broken down by state, area type (total/rural/urban), and age group. Here are the key columns you will work with:
- State: Serial numbers assigned to states.
- Area Name: The name of the state or union territory.
- Total/Rural/Urban: Indicates whether the data is for the total, rural, or urban population of that area.
- Adolescent and youth: The specific age group (e.g., 10-14, 15-19, 20-24).
- Total Male / Total Female: Total number of males and females.
- SC-M / SC-F: Total number of males and females belonging to Scheduled Castes.
- ST-M / ST-F: Total number of males and females belonging to Scheduled Tribes.
- Literates-M / Literates-F: Total number of literate males and females.
- LiteratesSC-M / LiteratesSC-F: Literate males and females of Scheduled Castes.
- LiteratesST-M / LiteratesST-F: Literate males and females of Scheduled Tribes.
- Illiterates-M / Illiterates-F: Total number of illiterate males and females.
- IlliteratesSC-M / IlliteratesSC-F: Illiterate males and females of Scheduled Castes.
- IlliteratesST-M / IlliteratesST-F: Illiterate males and females of Scheduled Tribes.
- MainWorker-M / MainWorker-F: Total number of main worker males and females.
- MainWorkerSC-M / MainWorkerSC-F: Main worker males and females of Scheduled Castes.
- MainWorkerST-M / MainWorkerST-F: Main worker males and females of Scheduled Tribes.
- MarginalWorker-M / MarginalWorker-F: Total number of marginal worker males and females.
- MarginalWorkerSC-M / MarginalWorkerSC-F: Marginal worker males and females of Scheduled Castes.
- MarginalWorkerST-M / MarginalWorkerST-F: Marginal worker males and females of Scheduled Tribes.
Types of Questions You Can Answer
With such a rich dataset, you can answer a wide variety of analytical questions. The textbook provides a list of 11 sample queries that demonstrate the range of possibilities. Your project should involve selecting 4-5 of these (or similar ones) and solving them step by step with full documentation.
Here are the sample questions:
- What is the total population, total male population and total female population aged 10 to 24 in India?
- Which State or Union Territory in India has the maximum number of illiterates in the youth ages?
- What is the percentage of people working as a marginal worker?
- List the top 5 states or union territories which have the maximum population working as a marginal worker.
- Compare the sex ratio of urban areas and rural areas using appropriate graph.
- Which state has the highest and the lowest percentage of literate Scheduled Tribes and Scheduled Castes?
- For each state, compare the number of female marginal workers with the number of male marginal workers using appropriate graphs.
- What percentage of Scheduled Tribes lives in urban areas? Draw a pie chart showing the proportion of literate and illiterate scheduled tribes living in urban areas.
- What is the state wise ratio of literates vs. illiterates in all age groups?
- Which state is home to the maximum number of ST in India? Which state has the minimum number of ST in India?
- For each state, find the number of literate females and literate males. Draw a bar graph for the same. Which state has the highest ratio of literate female vs literate male and which state has the minimum?
Step-by-Step Example: Solving Question 1
The textbook walks through the solution for the first question to give you a clear template for solving the others. The question is: What is the total population, total male population and total female population aged 10 to 24 in India?
The solution follows a structured, step-by-step approach.
Prerequisite: You must first download the CSV file (PCA_AY_2011_Revised.csv) using the QR code provided at the beginning of the chapter.
Step 0: Import Required Libraries
You start by importing the two essential Python libraries: pandas for data manipulation and matplotlib.pyplot for plotting.
import pandas as pd
import matplotlib.pyplot as plt
Step 1: Read the CSV File into a DataFrame
Load the CSV file into a pandas DataFrame.
data = pd.read_csv("PCA_AY_2011_Revised.csv")
df = pd.DataFrame(data)
Step 2: Check the Shape of the DataFrame
This confirms the size of the dataset.
print(df.shape)
The output will show (12168, 123), confirming 12,168 rows and 123 columns.
Step 3: Display the Columns
View all column names to understand what data is available.
print(df.columns.values)
You will see a list of 123 column names, including 'Area Name', 'Total/Rural/Urban', 'Adolescent and youth categories', 'Total Population - Persons', and many more.
Step 4: Filter Data
a. Identify the columns you need. For this question, you only need 'Area Name', 'Total/Rural/Urban', 'Adolescent and youth categories', and 'Total Population - Persons', 'Total Population - Males', 'Total Population - Females'.
b. Identify the rows you need. Check the values in the 'Area Name' column. You will see that the first few rows correspond to 'INDIA', followed by rows for states and districts. For this question, you only need data for 'INDIA'.
Step 5: Create a New DataFrame with Filtered Data
Use .loc[] to select only the rows where 'Area Name' is 'INDIA' and only the columns from 'Area Name' to 'Total Population - Females'.
df1 = df.loc[(df['Area Name'] == 'INDIA'), 'Area Name':'Total Population - Females']
Step 6: Rename Columns for Ease of Use
The original column names are very long. Rename them to shorter, more manageable names.
df1.columns = ['Area', 'Class', 'Category', 'TotalPop', 'MalePop', 'FemalePop']
Step 7: Group Data as per Requirement
When you print df1, you will see that the 'Category' column contains six different categories: '10-14', '15-19', '20-24', 'Adolescent (10-19)', 'All Ages', and 'Youth (15-24)'. To get the total population for each age group across all of India, you need to group by 'Category' and sum the population columns.
d = df1.groupby('Category').sum()
This gives you a new DataFrame d with the total population for each category. Since you are only interested in the specific age groups 10-14, 15-19, and 20-24, you drop the other rows.
d = d.drop(['Adolescent (10-19)', 'All Ages', 'Youth (15-24)'], axis=0)
``` …
What is the total population, total male population and total female population aged 10 to 24 in India? This worked example solves the first of the project's suggested questions end to end -- reading the Census CSV, checking its shape, filtering to the relevant age group, and aggregating the population totals -- as a model for how a student would …
['Table No.' 'State Code' 'District Code' 'Area Name'
 'Total/ Rural/ Urban' 'Adolescent and youth categories'
 'Total Population - Persons' 'Total Population - Males'
 'Total Population - Females' 'Scheduled Caste - Persons'
 'Scheduled Caste - Males' 'Scheduled Caste - Females'
                     ...
 'Scheduled Tribe Marginal Worker - Household Industry - Males'
 'Scheduled Tribe Marginal Worker - Household Industry - Females'
 'Scheduled Tribe Marginal Worker - Other Workers - Persons'
 'Scheduled Tribe Marginal Worker - Other Workers - Males' …
| Index | Area Name |
|---|---|
| 0 | INDIA |
| 1 | INDIA |
| 2 | INDIA |
| 3 | INDIA |
| 4 | INDIA |
| ... | ... |
| 12163 | District - South Andaman (03) |
| 12164 | District - South Andaman (03) |
| 12165 | District - South Andaman (03) |
| 12166 | District - South Andaman (03) |
| Area | Class | Category | TotalPop | MalePop | FemalePop | |
|---|---|---|---|---|---|---|
| 0 | INDIA | Total | All Ages | 1210854977 | 623270258 | 587584719 |
| 1 | INDIA | Total | 10-14 | 132709212 | 69418835 | 63290377 |
| 2 | INDIA | Total | 15-19 | 120526449 | 63982396 | 56544053 |
| 3 | INDIA | Total | 20-24 | 111424222 | 57584693 | 53839529 |
| 4 | INDIA | Total | Adolescent (10-19) | 253235661 | 133401231 | 119834430 |
| 5 | INDIA | Total | Youth (15-24) | 231950671 | 121567089 | 110383582 |
| 6 | INDIA | Rural | All Ages | 833748852 | 427781058 | 405967794 |
| 7 | INDIA | Rural | 10-14 | 96804494 | 50488158 | 46316336 |
| 8 | INDIA | Rural | 15-19 | 83902472 | 44570557 | 39331915 |
| 9 | INDIA | Rural | 20-24 | 73835046 | 38138662 | 35696384 |
| 10 | INDIA | Rural | Adolescent (10-19) | 180706966 | 95058715 | 85648251 |
| 11 | INDIA | Rural | Youth (15-24) | 157737518 | 82709219 | 75028299 |
| 12 | INDIA | Urban | All Ages | 377106125 | 195489200 | 181616925 |
| 13 | INDIA | Urban | 10-14 | 35904718 | 18930677 | 16974041 |
| 14 | INDIA | Urban | 15-19 | 36623977 | 19411839 | 17212138 |
| Category | TotalPop | MalePop | FemalePop |
|---|---|---|---|
| 10-14 | 265418424 | 138837670 | 126580754 |
| 15-19 | 241052898 | 127964792 | 113088106 |
| 20-24 | 222848444 | 115169386 | 107679058 |
| Adolescent (10-19) | 506471322 | 266802462 | 239668860 |
| Category | TotalPop | MalePop | FemalePop |
|---|---|---|---|
| 10-14 | 265418424 | 138837670 | 126580754 |
| 15-19 | 241052898 | 127964792 | 113088106 |
| 20-24 | 222848444 | 115169386 | 107679058 |
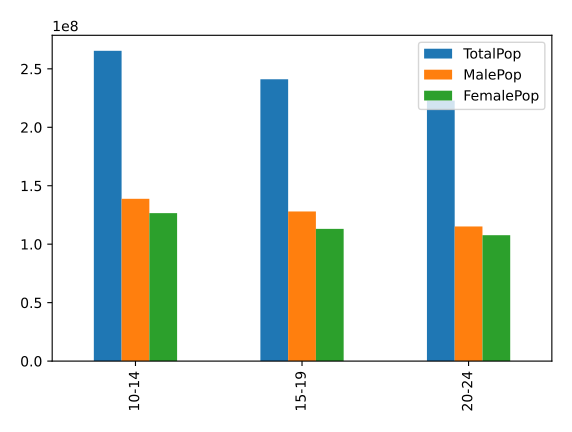
Drawn by us to help you understand the concept clearly, and verified to make sure it's accurate. For exams, practice from your textbook's own diagram.
The concluding chart of Task 1's steps: after the population table has been read, cleaned and reduced to the three age categories, one plotting call turns it into a grouped bar chart with three bars per category — TotalPop, MalePop and FemalePop, keyed by the legend. Two reading skills are exercised here. The '1e8' offset printed above the y-axis means every value is in hundreds of millions, matplotlib's scientific notation for large numbers. And the bar pattern carries the findings: the 10-14 group is the lar …